Unlock a world of possibilities! Login now and discover the exclusive benefits awaiting you.
- Qlik Community
- :
- All Forums
- :
- QlikView App Dev
- :
- Re: Rolling 12 Months Logic Required for every Mon...
- Subscribe to RSS Feed
- Mark Topic as New
- Mark Topic as Read
- Float this Topic for Current User
- Bookmark
- Subscribe
- Mute
- Printer Friendly Page
- Mark as New
- Bookmark
- Subscribe
- Mute
- Subscribe to RSS Feed
- Permalink
- Report Inappropriate Content
Rolling 12 Months Logic Required for every Month in Pivot Chart
Hi All,
I need help in calculating Rolling 12 Months Logic for every Month in Pivot Chart.
I've explained my requirement in Attached Excel.
Maybe someone has faced this issue earlier. Would Appreciate if someone provide solution to this.
PFA.
Regards,
Erric
- Mark as New
- Bookmark
- Subscribe
- Mute
- Subscribe to RSS Feed
- Permalink
- Report Inappropriate Content
Hi Check this.
Sheet1:
LOAD *,Date(MonthTemp,'MMM-YY') as Month,Year(MonthTemp) as Year;
LOAD [New Month Year] as MonthTemp,
Amount_1 as Amount,
[Desired Output]
FROM
rolling.xlsx
(ooxml, embedded labels, table is Sheet1);
Use this:
=SUM({<Year,Month = {">=$(=Date(MonthStart(Max(Month),-11),'MMM-YY'))<=$(=Date(MonthStart(Max(Month)),'MMM-YY'))"}>}Amount)
- Mark as New
- Bookmark
- Subscribe
- Mute
- Subscribe to RSS Feed
- Permalink
- Report Inappropriate Content
- Mark as New
- Bookmark
- Subscribe
- Mute
- Subscribe to RSS Feed
- Permalink
- Report Inappropriate Content
Hi Arjun,
Thanks for the reply.
I actually tried something like that but its not working:
Sum({<[New Month Year] ={"$(='>=' & Date(AddMonths(Max([New Month Year]), -11), 'MMM-YY') & '<=' & Date(Max([New Month Year]), 'MMM-YY'))"}>} TOTAL Amount_1)
Also, the Logic shared by you is not working.
Regards,
Erric
- Mark as New
- Bookmark
- Subscribe
- Mute
- Subscribe to RSS Feed
- Permalink
- Report Inappropriate Content
- Mark as New
- Bookmark
- Subscribe
- Mute
- Subscribe to RSS Feed
- Permalink
- Report Inappropriate Content
I recommend using The As-Of Table if you are able to modify the script... or this
RangeSum(Above(Sum(Amount_1), 0, 12))
- Mark as New
- Bookmark
- Subscribe
- Mute
- Subscribe to RSS Feed
- Permalink
- Report Inappropriate Content
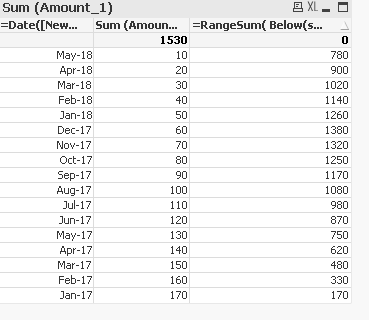
! !Hi
please find the attached app i got answer using strait table like below
=RangeSum( Below(sum(Amount_1), 0,12 ))
- Mark as New
- Bookmark
- Subscribe
- Mute
- Subscribe to RSS Feed
- Permalink
- Report Inappropriate Content
May be this expression
RangeSum(above(sum(Amount_1),0,12))
But if you select any monthyear in your listbox, then this will give only that monthyear amount.
- Mark as New
- Bookmark
- Subscribe
- Mute
- Subscribe to RSS Feed
- Permalink
- Report Inappropriate Content
But if you select any monthyear in your listbox, then this will give only that monthyear amount.
This can be addressed using this
RangeSum(Above(Sum({<MonthYear>}Amount_1), 0, 12)) * Avg(1)
- Mark as New
- Bookmark
- Subscribe
- Mute
- Subscribe to RSS Feed
- Permalink
- Report Inappropriate Content
Yes, this should work 