Unlock a world of possibilities! Login now and discover the exclusive benefits awaiting you.
- Qlik Community
- :
- All Forums
- :
- QlikView App Dev
- :
- Re: Rolling 3 months in chart
- Subscribe to RSS Feed
- Mark Topic as New
- Mark Topic as Read
- Float this Topic for Current User
- Bookmark
- Subscribe
- Mute
- Printer Friendly Page
- Mark as New
- Bookmark
- Subscribe
- Mute
- Subscribe to RSS Feed
- Permalink
- Report Inappropriate Content
Rolling 3 months in chart
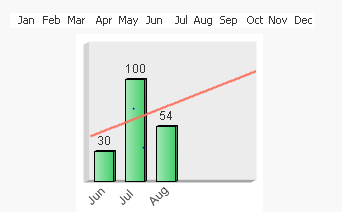
I have created the below chart with below information:-
Dimension : Claim_Month
Expression: count({<CLAIM_DATE={'>$(=AddMonths(Max(CLAIM_DATE),-3))'}>} Distinct CLAIM_ID)

This chart is showing me the max of month and previous two months always.
I wanted to show, If I select any month from top, then the chart should show, the selected month and previous 2 month in the chart.
Suppose, if I am selecting April from top list box, then my chart dimension should show Apr, Mar, Feb.
How can I do this? Please help me at the earliest.
- Tags:
- alluraiah allu
- Mark as New
- Bookmark
- Subscribe
- Mute
- Subscribe to RSS Feed
- Permalink
- Report Inappropriate Content
Can you try it with this expression:
Count({<CLAIM_DATE={'>$(=AddMonths(Max(CLAIM_DATE),-3))'}, MonthField = >} Distinct CLAIM_ID)
- Mark as New
- Bookmark
- Subscribe
- Mute
- Subscribe to RSS Feed
- Permalink
- Report Inappropriate Content
try this
count({<CLAIM_DATE={'>$(=AddMonths(Max(CLAIM_DATE),-3))<=$(=max(CLAIM_DATE))'}>} Distinct CLAIM_ID)
- Mark as New
- Bookmark
- Subscribe
- Mute
- Subscribe to RSS Feed
- Permalink
- Report Inappropriate Content
Hi Sunny, Thankyou for ur assistance. But this is not giving me the right month sets. Please help
- Mark as New
- Bookmark
- Subscribe
- Mute
- Subscribe to RSS Feed
- Permalink
- Report Inappropriate Content
Hi Settu,
Your solution is not giving me the right month sets. When I select any month from Claim_Month, then my chart dimension should show the selected month and previous two months. Please help.
- Mark as New
- Bookmark
- Subscribe
- Mute
- Subscribe to RSS Feed
- Permalink
- Report Inappropriate Content
can you post you app
- Mark as New
- Bookmark
- Subscribe
- Mute
- Subscribe to RSS Feed
- Permalink
- Report Inappropriate Content
Would you be able to elaborate so to what you are getting and what do you expect to see?
- Mark as New
- Bookmark
- Subscribe
- Mute
- Subscribe to RSS Feed
- Permalink
- Report Inappropriate Content
Hi,
please see this article
Calculating rolling n-period totals, averages or other aggregations
HTH
André Gomes
- Mark as New
- Bookmark
- Subscribe
- Mute
- Subscribe to RSS Feed
- Permalink
- Report Inappropriate Content
use this expression:
count({<CLAIM_DATE={'>$(=max(CLAIM_DATE)-3)<=$(=max(CLAIM_DATE))'}>} Distinct CLAIM_ID)