Unlock a world of possibilities! Login now and discover the exclusive benefits awaiting you.
- Qlik Community
- :
- All Forums
- :
- QlikView App Dev
- :
- Re: Running total and limiting the dimensions in c...
- Subscribe to RSS Feed
- Mark Topic as New
- Mark Topic as Read
- Float this Topic for Current User
- Bookmark
- Subscribe
- Mute
- Printer Friendly Page
- Mark as New
- Bookmark
- Subscribe
- Mute
- Subscribe to RSS Feed
- Permalink
- Report Inappropriate Content
Running total and limiting the dimensions in chart
Hi,
I have a dataset in the following form:
| User | Registered Month | Region |
| Sam1 | Jul 2012 | NAM |
| David2 | Jul 2012 | EMEA |
| John3 | Jul 2012 | EMEA |
| Karl4 | Jul 2012 | ASPAC |
| diego5 | Jul 2012 | LATAM |
| Charles6 | Jul 2012 | NAM |
| Harry7 | Jul 2012 | NAM |
| Tom8 | Jul 2012 | ASPAC |
| Edward9 | Jul 2012 | ASPAC |
| Alex10 | Jul 2012 | EMEA |
| Jose11 | Jul 2012 | ASPAC |
| Roborto12 | Jul 2012 | EMEA |
| Manuel13 | Jul 2012 | ASPAC |
| Tony14 | Jul 2012 | NAM |
| Mark15 | Aug 2012 | ASPAC |
| Ebony16 | Aug 2012 | LATAM |
| Katherine17 | Sep 2012 | EMEA |
| Liz18 | Oct 2012 | EMEA |
| Lara19 | Oct 2012 | EMEA |
| Jamie20 | Nov 2012 | EMEA |
This data goes up to the current month Jan 2014 and it can have many more dimensions based on the user's profile, like Country, Department,etc.
I am looking to have a chart that give me a running total of the number of registered users per month and on selecting any dimension the numbers should bring up the running total of the selections made.
I am able to get the running total in a chart using the formula: =rangesum(above(count(User),0,rowno()))
This gives me the running total from July 2012 - Jan 2014.
My issue is that I just want to show the chart for the last 12 month only. That is from Feb 2013 - Jan 2014. When I try to do that using the Limit Dimensions option in chart properties, the running total does not take in consideration that numbers before Feb 2013.
Results attached:


In the second image the counts are all incorrect for all the months. I have applied Dimension Limits to show only 12 largest values.
How can I show just the previous 12 month running totals with the correct numbers.
Appreciate any help with this.
thanks,
Amit.
- Tags:
- chart
- Mark as New
- Bookmark
- Subscribe
- Mute
- Subscribe to RSS Feed
- Permalink
- Report Inappropriate Content
Two options I can think of:
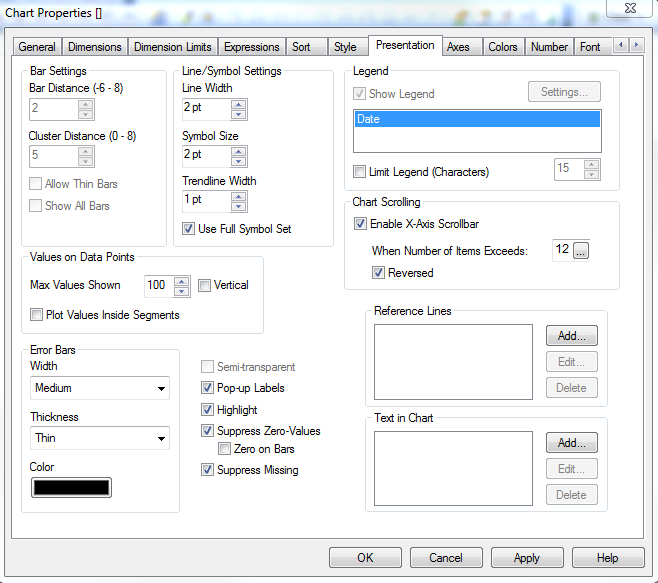
1. On Presentation tab, enable x-axis scrollbar when number of items exceeds 12 and set it to reversed, so that it only shows the 12 latest months, but gives the user the ability to scroll back to previous months if they so wish:

2. Calculate the rolling totals in the load script.
- Mark as New
- Bookmark
- Subscribe
- Mute
- Subscribe to RSS Feed
- Permalink
- Report Inappropriate Content
I'd say your dataset ist can be classified as a transaction fact table, holding one row per registered user. This single row is linked to your calendar dimension by the field "Registration Month". So in a qlikview "associative world" all rows with any "Registration Month" value before (or after) the user selected calendar range won't be considered in any calculation UNLESS you alter the current data set by a set analysis expression. The rangesum approach is a nice one on this case. I don't have a deep understanding of the rangesum function, however it seems to extend the user selected calendar range exactly like a set analysis expression would do. Unfortunately i find myself in a similar situation and haven't found a solution yet.
Precalculating rolling totals would disable the ability to dynamicly filter or group by any other linked dimension (branch, sales pipeline, region, ... ). Unless you would precalculate the rolling total for all linked dimensions (and hierarchy levels) which would basically be an olap cube for which qlikview is the wrong tool.
What i am doing currently in my project is to create multiple fact rows per user. One for each month from the registration month until unsubscription or (if still registered) the end of my master calendar; This way you have the full set of registered users linked to each of your calendar periods. However you have to be cautious with this approach as well, because if you sum up your registrations across a Quarter or a Year (multiple units of your finest calendar grain) each User will show up multiple times. So you have to use count(distinct <field>) which will lead to bad performance. I'd classify this as a "non accumulative snapshot fact table" by month (or whatever your finest calendar grain is). However this is only doable with small data sets rough calendar grain and/or if users registration total timespan is relativeley short. My use case it to track ~ 60.000 employees across an average emloyment duration of 3 years on a daily basis which sums up to 70.000.000 individual fact rows. Executing a qv script implementing this approach recently made our server crash !!!
So i'm about to reconsider our datamodel to a "transaction fact" based one, which in turn throws up the exact same presentations issues you described which really dimishes usability in my opinion.
See the attached example file, appreciate any help.