Unlock a world of possibilities! Login now and discover the exclusive benefits awaiting you.
- Qlik Community
- :
- All Forums
- :
- QlikView App Dev
- :
- Running total in bar chart
Options
- Subscribe to RSS Feed
- Mark Topic as New
- Mark Topic as Read
- Float this Topic for Current User
- Bookmark
- Subscribe
- Mute
- Printer Friendly Page
Turn on suggestions
Auto-suggest helps you quickly narrow down your search results by suggesting possible matches as you type.
Showing results for
Contributor II
2021-02-08
12:35 PM
- Mark as New
- Bookmark
- Subscribe
- Mute
- Subscribe to RSS Feed
- Permalink
- Report Inappropriate Content
Running total in bar chart
Hi all,
I am having 8 weeks data of 4 team each team having 5 members. I need to show running total of Production % of users in bar chart with selection of Team name and Week number.
Production % = Production units / Working Days.
When I Select week 1 it should show week 1 Production % of users.
When I select Week 2 it should show Production % of week 1 + Production % of week 2, as like for rest of weeks.
for above calculation I have written formula as like below.
sum({<[Week Num]={">=$(=(week(Yearstart(Max([Week Num]))))) <=$(=Max([Week Num]))"}>} AGGR(sum({1}[Production Units]),Team,[Week Num]) / Aggr(sum({1}[Working Days Count]),Team,[Week Num]))
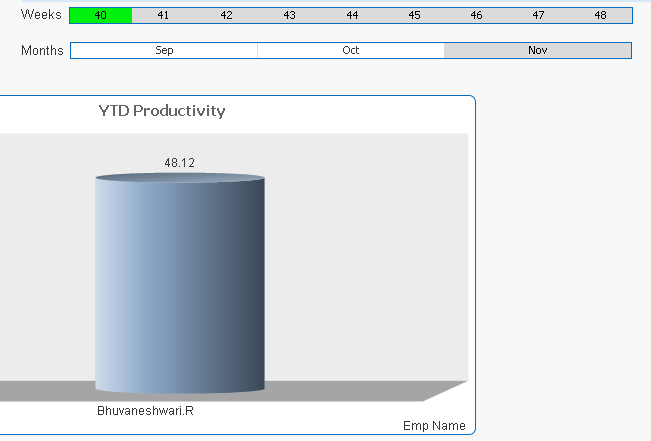
What is my problem is when I select week 1 it shows only 1 user name in bar chart and 2 user name when I select week 2.
Can anybody advise where is mistake happens. Thanks in Advance.
- Tags:
- new_to_qlikview
434 Views
1 Reply
Master II
2021-02-08
02:14 PM
- Mark as New
- Bookmark
- Subscribe
- Mute
- Subscribe to RSS Feed
- Permalink
- Report Inappropriate Content
this is a great place to start:
Running totals per dimension (RangeSum(), sortable... - Qlik Community - 1487351
407 Views