Unlock a world of possibilities! Login now and discover the exclusive benefits awaiting you.
- Qlik Community
- :
- All Forums
- :
- QlikView App Dev
- :
- Re: Second axes in line chart
- Subscribe to RSS Feed
- Mark Topic as New
- Mark Topic as Read
- Float this Topic for Current User
- Bookmark
- Subscribe
- Mute
- Printer Friendly Page
- Mark as New
- Bookmark
- Subscribe
- Mute
- Subscribe to RSS Feed
- Permalink
- Report Inappropriate Content
Second axes in line chart
Dear Colleagues, good day!
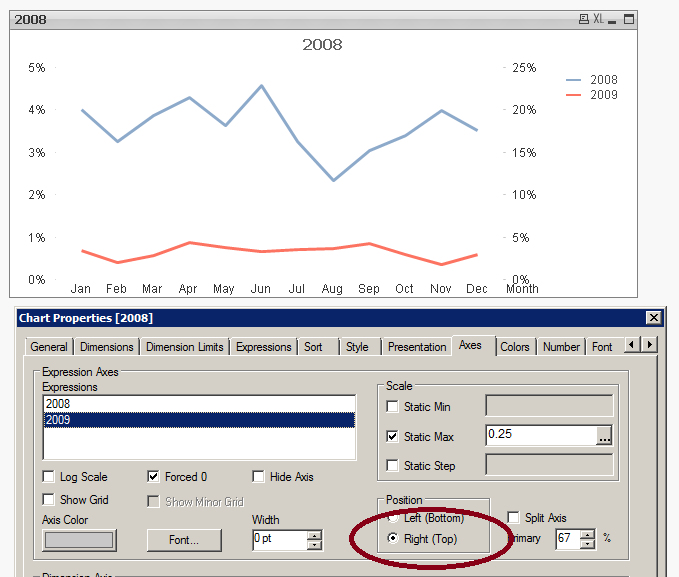
I have line chart with 2 expr. Is there any way to add second axes for second expr?
Example in attachment.
Many thanks.
Accepted Solutions
- Mark as New
- Bookmark
- Subscribe
- Mute
- Subscribe to RSS Feed
- Permalink
- Report Inappropriate Content
You can choose to put the second expression on the secondary axis on the Axes tab. It's a bad idea because you'll create a confusing chart. It's better to use two charts for this. Can you tell which expression belongs on which axis if you only look at the chart?

talk is cheap, supply exceeds demand
- Mark as New
- Bookmark
- Subscribe
- Mute
- Subscribe to RSS Feed
- Permalink
- Report Inappropriate Content
You can choose to put the second expression on the secondary axis on the Axes tab. It's a bad idea because you'll create a confusing chart. It's better to use two charts for this. Can you tell which expression belongs on which axis if you only look at the chart?

talk is cheap, supply exceeds demand
- Mark as New
- Bookmark
- Subscribe
- Mute
- Subscribe to RSS Feed
- Permalink
- Report Inappropriate Content
Hi,
I would have to agree with Gysbert, I would approach as two charts.
In the Axes tab highlight the expression > Tick split axes.
Mark
- Mark as New
- Bookmark
- Subscribe
- Mute
- Subscribe to RSS Feed
- Permalink
- Report Inappropriate Content
No, i can't tell at once dependence between expr and axes.
Now i'm trying to show second axes and it's display isn't practical.
Could you advice something for it please?
- Mark as New
- Bookmark
- Subscribe
- Mute
- Subscribe to RSS Feed
- Permalink
- Report Inappropriate Content
This is happening becoz of -ve values in expression..
Could you post sample data for same?
- Mark as New
- Bookmark
- Subscribe
- Mute
- Subscribe to RSS Feed
- Permalink
- Report Inappropriate Content
will this help you?
see the attachment..
- Mark as New
- Bookmark
- Subscribe
- Mute
- Subscribe to RSS Feed
- Permalink
- Report Inappropriate Content
My advice is to use two separate line charts.
talk is cheap, supply exceeds demand
- Mark as New
- Bookmark
- Subscribe
- Mute
- Subscribe to RSS Feed
- Permalink
- Report Inappropriate Content
Hi,
Uncheck the "Forced 0" option it will look nicer.
- Mark as New
- Bookmark
- Subscribe
- Mute
- Subscribe to RSS Feed
- Permalink
- Report Inappropriate Content