Unlock a world of possibilities! Login now and discover the exclusive benefits awaiting you.
- Qlik Community
- :
- All Forums
- :
- QlikView App Dev
- :
- Re: Set Analysis Expression
- Subscribe to RSS Feed
- Mark Topic as New
- Mark Topic as Read
- Float this Topic for Current User
- Bookmark
- Subscribe
- Mute
- Printer Friendly Page
- Mark as New
- Bookmark
- Subscribe
- Mute
- Subscribe to RSS Feed
- Permalink
- Report Inappropriate Content
Set Analysis Expression
Friends,
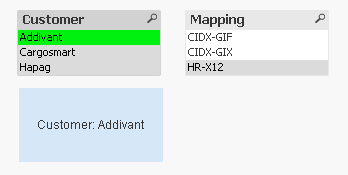
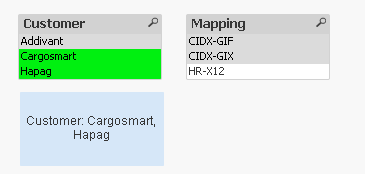
I have filters as in the screenshots below,


In customer listbox, the customer 'Addivant' has two mappings but other two customers has 1 mapping which is not common to the customer 'Addivant'.
When I click on Cargosmart, it should display Hapag customer (mapping matched with the selected customer) and vice-versa. If Addivant gets selected, nothing will be displayed in the text object, because it's mapping is not common to any customer.
Plz help me to create an expression for this, guys...
Accepted Solutions
- Mark as New
- Bookmark
- Subscribe
- Mute
- Subscribe to RSS Feed
- Permalink
- Report Inappropriate Content
You need to use the same set analysis in your expression.... don't really need to touch the dimension. Expression will take care of the dimension
{<Customer = e(Customer), Mapping = p(Mapping)>}
or this
{<Mapping = p(Mapping)>}
Whichever one worked, add it to your chart's expression
- Mark as New
- Bookmark
- Subscribe
- Mute
- Subscribe to RSS Feed
- Permalink
- Report Inappropriate Content
May be like this
Concat(DISTINCT {<Customer = e(Customer), Mapping = p(Mapping)>} Customer, ', ')
or
Concat(DISTINCT {<Mapping = p(Mapping)>} Customer, ', ')
- Mark as New
- Bookmark
- Subscribe
- Mute
- Subscribe to RSS Feed
- Permalink
- Report Inappropriate Content
Thanks Sunny, its working. But if I use this expression in the calculated dimension of a bar chart, its not working.
- Mark as New
- Bookmark
- Subscribe
- Mute
- Subscribe to RSS Feed
- Permalink
- Report Inappropriate Content
You need to use the same set analysis in your expression.... don't really need to touch the dimension. Expression will take care of the dimension
{<Customer = e(Customer), Mapping = p(Mapping)>}
or this
{<Mapping = p(Mapping)>}
Whichever one worked, add it to your chart's expression
- Mark as New
- Bookmark
- Subscribe
- Mute
- Subscribe to RSS Feed
- Permalink
- Report Inappropriate Content
Thank you so much.. It's working.
- Mark as New
- Bookmark
- Subscribe
- Mute
- Subscribe to RSS Feed
- Permalink
- Report Inappropriate Content
Hi
If you must use the set analysis in the calculated dimension, use this expression
=Aggr(Only(<set expr> Customer),Customer)
set expr = whichever of the set expressions from Sunny's response is working for you.
Remember to supress null for the dimension.