Unlock a world of possibilities! Login now and discover the exclusive benefits awaiting you.
- Qlik Community
- :
- All Forums
- :
- QlikView App Dev
- :
- Re: Set Analysis in expression when one date equal...
- Subscribe to RSS Feed
- Mark Topic as New
- Mark Topic as Read
- Float this Topic for Current User
- Bookmark
- Subscribe
- Mute
- Printer Friendly Page
- Mark as New
- Bookmark
- Subscribe
- Mute
- Subscribe to RSS Feed
- Permalink
- Report Inappropriate Content
Set Analysis in expression when one date equals another
All,
This should be a simple task, but for some reason I might be over complicating it. I have a Summary_Date column, a Account_Open_Date and Balances. I want the pivot table to just show the Balances where the Account_Open_Date equals the Summary_Date. Here is a sample:
LOAD * INLINE [
Summary Date, Account ID, Customer, Account Open Date, Balances
2018-01-31, 1, A, 2018-01-31, 100
2018-02-28, 1, A, 2018-01-31, 200
2018-03-31, 1, A, 2018-01-31, 300
2018-04-30, 1, A, 2018-01-31, 400
2018-05-31, 1, A, 2018-01-31, 500
2018-06-30, 1, A, 2018-01-31, 600
2018-04-30, 2, B, 2018-04-30, 100
2018-05-31, 2, B, 2018-04-30, 200
2018-06-30, 2, B, 2018-04-30, 300
2017-01-31, 3, C, 2017-01-31, 100
2017-02-28, 3, C, 2017-01-31, 200
2017-03-31, 3, C, 2017-01-31, 300
2017-04-30, 3, C, 2017-01-31, 400
2017-05-31, 3, C, 2017-01-31, 500
2017-06-30, 3, C, 2017-01-31, 600
2017-07-31, 3, C, 2017-01-31, 700
2017-08-31, 3, C, 2017-01-31, 800
2017-09-30, 3, C, 2017-01-31, 900
2017-10-31, 3, C, 2017-01-31, 1000
2017-11-30, 3, C, 2017-01-31, 1100
2017-12-31, 3, C, 2017-01-31, 1200
2018-01-31, 3, C, 2017-01-31, 1300
2018-02-28, 3, C, 2017-01-31, 1400
2018-03-31, 3, C, 2017-01-31, 1500
2018-04-30, 3, C, 2017-01-31, 1600
2018-05-31, 3, C, 2017-01-31, 1700
2018-06-30, 3, C, 2017-01-31, 1800
];
So I would this to be only 100 for 2018-01-31 and 100 fir 2018-04-30.
Your help is more than appreciated.
Regards,
Aksel
Accepted Solutions
- Mark as New
- Bookmark
- Subscribe
- Mute
- Subscribe to RSS Feed
- Permalink
- Report Inappropriate Content
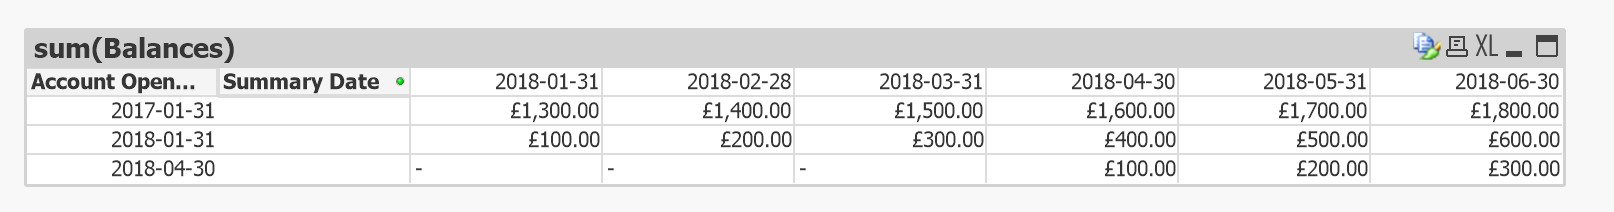
are you looking for this?

If Yes,
try like below
Dates:
LOAD *, Floor(Date#(SummaryDate, 'YYYY-MM-DD')) AS SumDtID, Floor(Date#(AccountOpenDate, 'YYYY-MM-DD')) AS AcctDtID INLINE [
SummaryDate, AccountID, Customer, AccountOpenDate, Balances
2018-01-31, 1, A, 2018-01-31, 100
2018-02-28, 1, A, 2018-01-31, 200
2018-03-31, 1, A, 2018-01-31, 300
2018-04-30, 1, A, 2018-01-31, 400
2018-05-31, 1, A, 2018-01-31, 500
2018-06-30, 1, A, 2018-01-31, 600
2018-04-30, 2, B, 2018-04-30, 100
2018-05-31, 2, B, 2018-04-30, 200
2018-06-30, 2, B, 2018-04-30, 300
2017-01-31, 3, C, 2017-01-31, 100
2017-02-28, 3, C, 2017-01-31, 200
2017-03-31, 3, C, 2017-01-31, 300
2017-04-30, 3, C, 2017-01-31, 400
2017-05-31, 3, C, 2017-01-31, 500
2017-06-30, 3, C, 2017-01-31, 600
2017-07-31, 3, C, 2017-01-31, 700
2017-08-31, 3, C, 2017-01-31, 800
2017-09-30, 3, C, 2017-01-31, 900
2017-10-31, 3, C, 2017-01-31, 1000
2017-11-30, 3, C, 2017-01-31, 1100
2017-12-31, 3, C, 2017-01-31, 1200
2018-01-31, 3, C, 2017-01-31, 1300
2018-02-28, 3, C, 2017-01-31, 1400
2018-03-31, 3, C, 2017-01-31, 1500
2018-04-30, 3, C, 2017-01-31, 1600
2018-05-31, 3, C, 2017-01-31, 1700
2018-06-30, 3, C, 2017-01-31, 1800
];
Then in Pivot add Dim
Summary date and Account open date
Expr:
= Sum(IF(AcctDtID = SumDtID, Balances))
- Mark as New
- Bookmark
- Subscribe
- Mute
- Subscribe to RSS Feed
- Permalink
- Report Inappropriate Content
are you looking for this?
If Yes,
try like below
Dates:
LOAD *, Floor(Date#(SummaryDate, 'YYYY-MM-DD')) AS SumDtID, Floor(Date#(AccountOpenDate, 'YYYY-MM-DD')) AS AcctDtID INLINE [
SummaryDate, AccountID, Customer, AccountOpenDate, Balances
2018-01-31, 1, A, 2018-01-31, 100
2018-02-28, 1, A, 2018-01-31, 200
2018-03-31, 1, A, 2018-01-31, 300
2018-04-30, 1, A, 2018-01-31, 400
2018-05-31, 1, A, 2018-01-31, 500
2018-06-30, 1, A, 2018-01-31, 600
2018-04-30, 2, B, 2018-04-30, 100
2018-05-31, 2, B, 2018-04-30, 200
2018-06-30, 2, B, 2018-04-30, 300
2017-01-31, 3, C, 2017-01-31, 100
2017-02-28, 3, C, 2017-01-31, 200
2017-03-31, 3, C, 2017-01-31, 300
2017-04-30, 3, C, 2017-01-31, 400
2017-05-31, 3, C, 2017-01-31, 500
2017-06-30, 3, C, 2017-01-31, 600
2017-07-31, 3, C, 2017-01-31, 700
2017-08-31, 3, C, 2017-01-31, 800
2017-09-30, 3, C, 2017-01-31, 900
2017-10-31, 3, C, 2017-01-31, 1000
2017-11-30, 3, C, 2017-01-31, 1100
2017-12-31, 3, C, 2017-01-31, 1200
2018-01-31, 3, C, 2017-01-31, 1300
2018-02-28, 3, C, 2017-01-31, 1400
2018-03-31, 3, C, 2017-01-31, 1500
2018-04-30, 3, C, 2017-01-31, 1600
2018-05-31, 3, C, 2017-01-31, 1700
2018-06-30, 3, C, 2017-01-31, 1800
];
Then in Pivot add Dim
Summary date and Account open date
Expr:
= Sum(IF(AcctDtID = SumDtID, Balances))
- Mark as New
- Bookmark
- Subscribe
- Mute
- Subscribe to RSS Feed
- Permalink
- Report Inappropriate Content
Yes, but I just want to restrict to those days. So don't want to see the other dates. But then your code gave me my jump start my brain needed:)
I just needed to do the last bit.
sum(if([Summary Date] = [Account Open Date],Balances))
That gave me what I was looking for!
Thanks again,
Aksel
- Mark as New
- Bookmark
- Subscribe
- Mute
- Subscribe to RSS Feed
- Permalink
- Report Inappropriate Content
In presentation tab of your Pivot chart properties, supress zero values.
I used the DateID's coz it is always a better practice to use Integer comparisons rather than string values hence created two DateIDs.
- Mark as New
- Bookmark
- Subscribe
- Mute
- Subscribe to RSS Feed
- Permalink
- Report Inappropriate Content
How do I check if the field I use is String or Integer? Or do you just convert it to string by using DATE# regardless.
The reason I ask is because, when I have dates that are not monthends I seem to be running in to some issues. So I use;
Date#(MonthEnd(SUMMARY_DATE,'YYYY-MM-DD')) which is not bringing in any data.