Unlock a world of possibilities! Login now and discover the exclusive benefits awaiting you.
- Qlik Community
- :
- All Forums
- :
- QlikView App Dev
- :
- Re: Set analysis problem with value formats
- Subscribe to RSS Feed
- Mark Topic as New
- Mark Topic as Read
- Float this Topic for Current User
- Bookmark
- Subscribe
- Mute
- Printer Friendly Page
- Mark as New
- Bookmark
- Subscribe
- Mute
- Subscribe to RSS Feed
- Permalink
- Report Inappropriate Content
Set analysis problem with value formats
I have an urgent problem with set anlayis. I have to monitor price changes and need to know for how long the lowes/highest price was valid. I build some test case and it works fine for numbers without digits but not for numbers with digits nor for my real data.
Example:
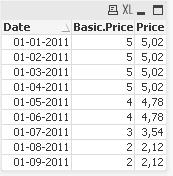
With the Basic price the following works fine (in words: search the min.date for the min.Price):
=min( {$<(Basic.Price = { $(=min(Basic.Price)) }> } Date )&' - '&max( { $<Basic.Price = { $(=min(Basic.Price)) }> } Date )
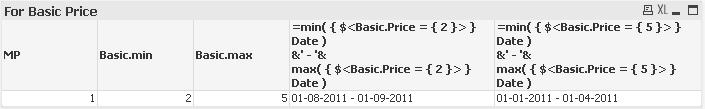
However, with numbers with digits it does not work:
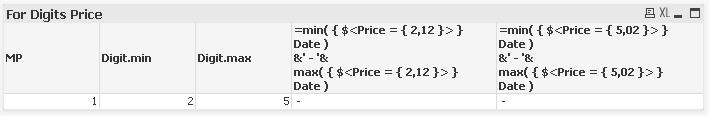
The function min(Price) gives back the correct value of 2,12 but this as input for the selection in the SET seems to be a problem....
I attached the example QV-file.
Any ideas ?
Christian
Accepted Solutions
- Mark as New
- Bookmark
- Subscribe
- Mute
- Subscribe to RSS Feed
- Permalink
- Report Inappropriate Content
Hi,
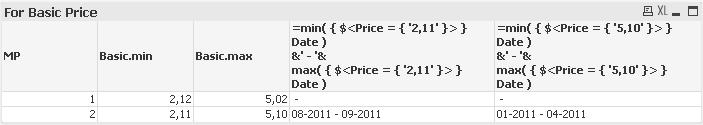
I think the returned comma of min(Price) is problematic and the set element expression should use '' like
=min( { $<Price = {'$(=min(Price))'}> } Date )
&' - '&
max( { $<Price = {'$(=min(Price))'}> } Date )
(Note that I guarded the dollar sign expression with ' '. That way it works for me.
Stefan
- Mark as New
- Bookmark
- Subscribe
- Mute
- Subscribe to RSS Feed
- Permalink
- Report Inappropriate Content
Hi,
I think the returned comma of min(Price) is problematic and the set element expression should use '' like
=min( { $<Price = {'$(=min(Price))'}> } Date )
&' - '&
max( { $<Price = {'$(=min(Price))'}> } Date )
(Note that I guarded the dollar sign expression with ' '. That way it works for me.
Stefan
- Mark as New
- Bookmark
- Subscribe
- Mute
- Subscribe to RSS Feed
- Permalink
- Report Inappropriate Content
Hi Christian,
Please find the attached solution for the issue.
Please note:
=min( { $<Price = { '$(=min(Price))' }> } Date )
&' - '&
max( { $<Price = { '$(=min(Price))' }> } Date )
Let me know if this solves your issue.
Regards,
H
- Mark as New
- Bookmark
- Subscribe
- Mute
- Subscribe to RSS Feed
- Permalink
- Report Inappropriate Content
Thank you both, this works for my example. No I realize the next issue:
When I add a second product (field MP has now >1 value) the set-analysis ignores this dimension in the chart-table. As a result I find the only the date when the minPrice is the absolute min, not the min for the product.
How to take into account the dimension ?
(Attached an updated example)
- Mark as New
- Bookmark
- Subscribe
- Mute
- Subscribe to RSS Feed
- Permalink
- Report Inappropriate Content
Hi,
I believe what you want to achieve is quite hard using set analysis, if possible at all.
But using advanced aggregation, it's possible.
Please have a look at my attached sample.
Regards,
Stefan
- Mark as New
- Bookmark
- Subscribe
- Mute
- Subscribe to RSS Feed
- Permalink
- Report Inappropriate Content
Hi Stefan,
thank you very much !!
This completely solves the problem (even if the aggr-function took a bit longer to understand...)
Let's hope, that QV implements a set analysis also interpreting the chart dimension as per line selection to be added to the set-analysis selection in a future version...
Again, thank you
Christian