Unlock a world of possibilities! Login now and discover the exclusive benefits awaiting you.
- Qlik Community
- :
- All Forums
- :
- QlikView App Dev
- :
- Re: Re: Re: Set color on basis of condition
- Subscribe to RSS Feed
- Mark Topic as New
- Mark Topic as Read
- Float this Topic for Current User
- Bookmark
- Subscribe
- Mute
- Printer Friendly Page
- Mark as New
- Bookmark
- Subscribe
- Mute
- Subscribe to RSS Feed
- Permalink
- Report Inappropriate Content
Set color on basis of condition
I am comparing data of two baseball teams and I want second team's data color on basis of data of first team
Example If first team have win/loss ratio = 1.42 and second team have win/loss ratio 2.00 then second team's ratio must be in green color if it is greater than that of first and red if less than that of first.
Here, both teams have different states(not the default one,i.e., inherited)
Win/Loss Ratio for first team is calculated as-
avg(aggr(avg({p7}Win_Loss_Ratio),TeamID))
Please Help.
Thanks in Advance.
(Attaching Image for reference)
Accepted Solutions
- Mark as New
- Bookmark
- Subscribe
- Mute
- Subscribe to RSS Feed
- Permalink
- Report Inappropriate Content
great. I added the SET STATEMENT to the outer avg() function as well:
=if(avg( {p7}aggr(avg({p7}Win_Loss_Ratio),TeamID))>(avg( {p8} aggr(avg({p8}Win_Loss_Ratio),TeamID))),Red(255),Black(255))
It seems to work now.
- Mark as New
- Bookmark
- Subscribe
- Mute
- Subscribe to RSS Feed
- Permalink
- Report Inappropriate Content
Hi Saurabh
You can set the text colour in the expression, expand the + sign and define your logic in there against text colour
Hope this works
Thanks
Padma
- Mark as New
- Bookmark
- Subscribe
- Mute
- Subscribe to RSS Feed
- Permalink
- Report Inappropriate Content
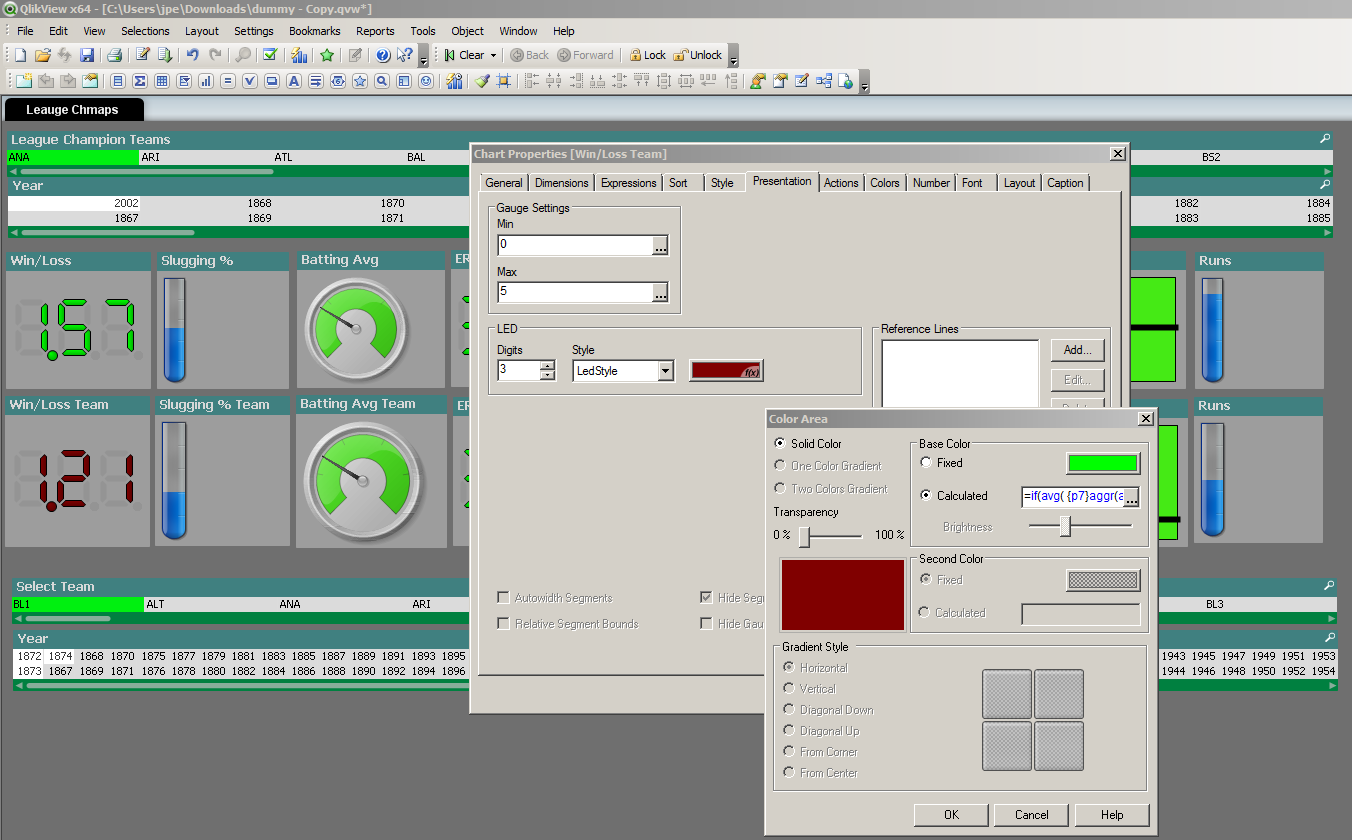
In the presentation tab of Win/loss ratio graph, I have specified the calculated color as follows-
=if(avg(aggr(avg({p7}Win_Loss_Ratio),TeamID))>(avg(aggr(avg({p8}Win_Loss_Ratio),TeamID))),Red(255),Black(255))
Here, <> is working but not greater than or less than.
- Mark as New
- Bookmark
- Subscribe
- Mute
- Subscribe to RSS Feed
- Permalink
- Report Inappropriate Content
do you want to share the QVW to take a closer look ?
- Mark as New
- Bookmark
- Subscribe
- Mute
- Subscribe to RSS Feed
- Permalink
- Report Inappropriate Content
Sure
- Mark as New
- Bookmark
- Subscribe
- Mute
- Subscribe to RSS Feed
- Permalink
- Report Inappropriate Content
Actually, I have tried to do so but unable to drag and drop and there is no option to attach the file.
If you can tell me how to attach my qvw, it will be beneficial for me.

p7 and p8 represent state of first and second team correspondingly.
Thanks
- Mark as New
- Bookmark
- Subscribe
- Mute
- Subscribe to RSS Feed
- Permalink
- Report Inappropriate Content
When you reply hit 'use advanced editor' and then you can upload files.
- Mark as New
- Bookmark
- Subscribe
- Mute
- Subscribe to RSS Feed
- Permalink
- Report Inappropriate Content
This is my qvw File.
I am comparing two teams data.
Thanks Saurabh
- Mark as New
- Bookmark
- Subscribe
- Mute
- Subscribe to RSS Feed
- Permalink
- Report Inappropriate Content
great. I added the SET STATEMENT to the outer avg() function as well:
=if(avg( {p7}aggr(avg({p7}Win_Loss_Ratio),TeamID))>(avg( {p8} aggr(avg({p8}Win_Loss_Ratio),TeamID))),Red(255),Black(255))
It seems to work now.
- Mark as New
- Bookmark
- Subscribe
- Mute
- Subscribe to RSS Feed
- Permalink
- Report Inappropriate Content
Thanks.
It worked.