Unlock a world of possibilities! Login now and discover the exclusive benefits awaiting you.
- Qlik Community
- :
- All Forums
- :
- QlikView App Dev
- :
- Setting in largest values chart properties
- Subscribe to RSS Feed
- Mark Topic as New
- Mark Topic as Read
- Float this Topic for Current User
- Bookmark
- Subscribe
- Mute
- Printer Friendly Page
- Mark as New
- Bookmark
- Subscribe
- Mute
- Subscribe to RSS Feed
- Permalink
- Report Inappropriate Content
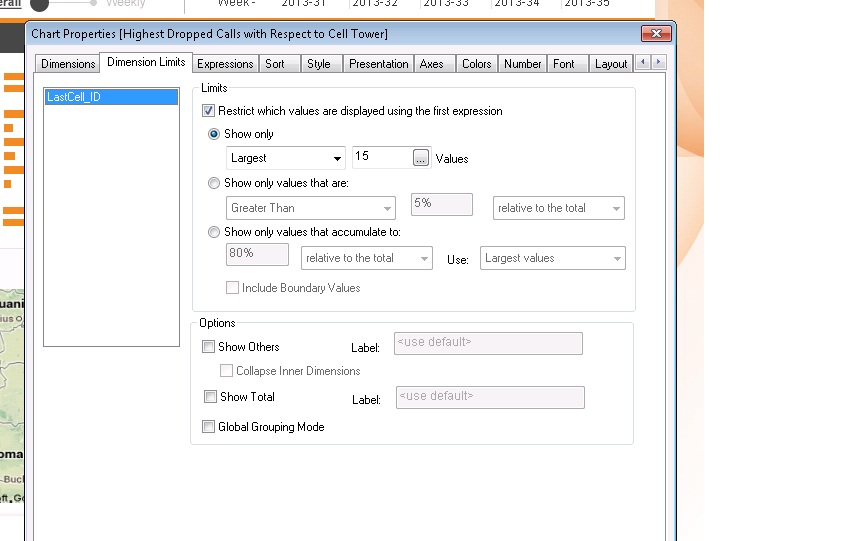
Setting in largest values chart properties
Hello experts,
Can you please tell me when to set largest values in chart properties as shown in attachments.
Thanks in advance.
Regards,
Deepak
- Mark as New
- Bookmark
- Subscribe
- Mute
- Subscribe to RSS Feed
- Permalink
- Report Inappropriate Content
Hi,
Largest value is set when you would like to see only top few values( as in this example top 15).
Regards,
Varsha
- Mark as New
- Bookmark
- Subscribe
- Mute
- Subscribe to RSS Feed
- Permalink
- Report Inappropriate Content
for showing only 15 largest value you can do it by using either dimension limit tab or using rank function
for all values to be shown largest to smallest simply for that particular dimension in sort tab y-value in descending order
hope it helps
- Mark as New
- Bookmark
- Subscribe
- Mute
- Subscribe to RSS Feed
- Permalink
- Report Inappropriate Content
Can you please tell me when to enable x axis scrollbar.
- Mark as New
- Bookmark
- Subscribe
- Mute
- Subscribe to RSS Feed
- Permalink
- Report Inappropriate Content
yes. see the attached image the first one is that if i have lots of vailues in dimension on the bases of my expression
then i enable the scroll bar with limits like 10 or 12 whatever you want so that it display the data in graphical is good to see you otherwise with a multiple expressions on one dimension it could be compct and doesn't understand by user also
so we enables scroll bar
otherwise if you only want to show few values on the basis of expression then by default its uncheck and see the data if it would be right
hope it helps
first image to enable scrollbar and 2nd one is without enable