Unlock a world of possibilities! Login now and discover the exclusive benefits awaiting you.
- Qlik Community
- :
- All Forums
- :
- QlikView App Dev
- :
- Show Textbox if Chart shows "No data to display"
- Subscribe to RSS Feed
- Mark Topic as New
- Mark Topic as Read
- Float this Topic for Current User
- Bookmark
- Subscribe
- Mute
- Printer Friendly Page
- Mark as New
- Bookmark
- Subscribe
- Mute
- Subscribe to RSS Feed
- Permalink
- Report Inappropriate Content
Show Textbox if Chart shows "No data to display"
Hi,
I am trying to show Textbox on chart saying "On Time" if there is "No data to display". Otherwise show charts.
- Mark as New
- Bookmark
- Subscribe
- Mute
- Subscribe to RSS Feed
- Permalink
- Report Inappropriate Content
Hi Dipesh,
There's the calculation conditions in qlikview and you can set an accordingly message to it (like bellow).
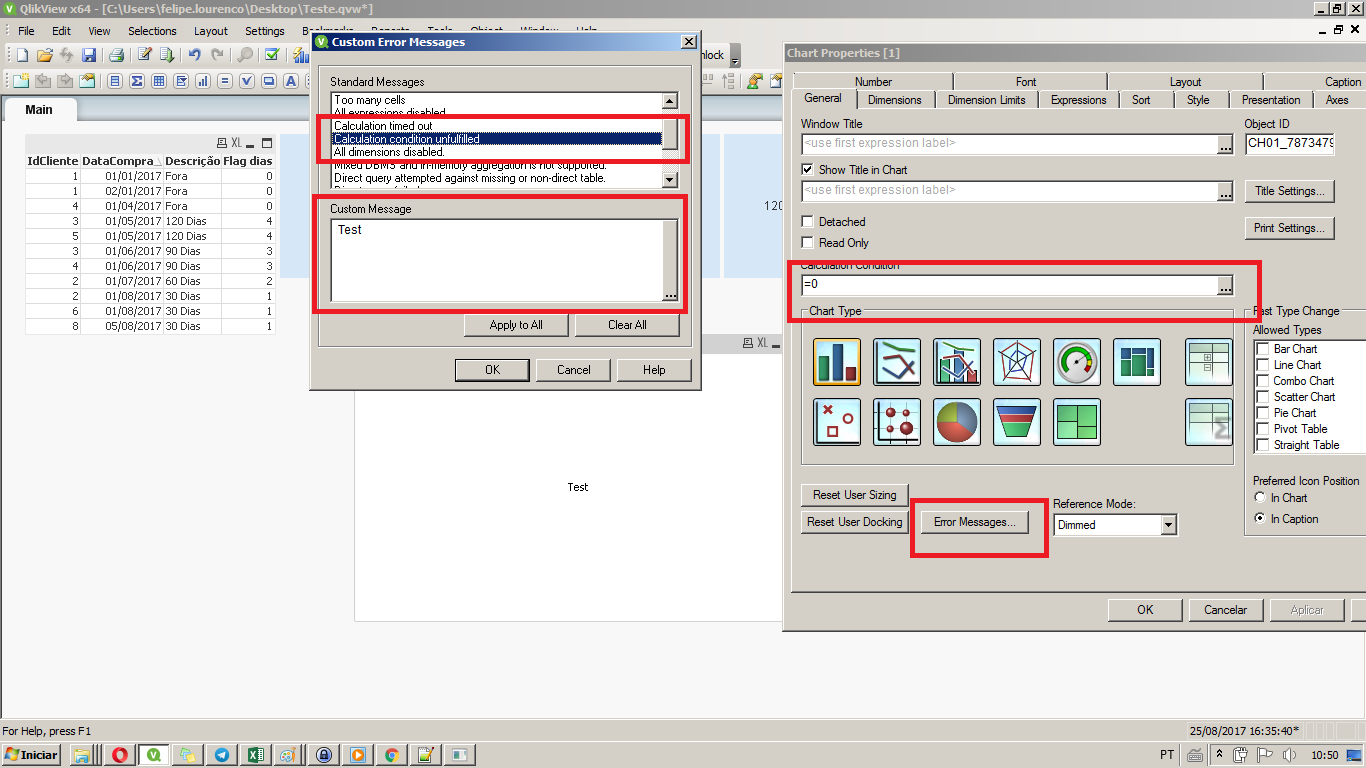
So my condtiotion for the chart is some kind of calculation (in my case, always false) and it shows the error message i've set in the box as 'Test'.
Felipe.
- Mark as New
- Bookmark
- Subscribe
- Mute
- Subscribe to RSS Feed
- Permalink
- Report Inappropriate Content
Rather than using Text object use chart properties for this go to Error Message >> Calculation Condition Unfiled >> and write your message over there.
- Mark as New
- Bookmark
- Subscribe
- Mute
- Subscribe to RSS Feed
- Permalink
- Report Inappropriate Content
In chart properties->General tab-> In calculated condition use below expression
= (YourExpression) > 0
Click on Error Message in General tab of chart properties
Click on " calculation condition unfulfiled" and write " On Time"
- Mark as New
- Bookmark
- Subscribe
- Mute
- Subscribe to RSS Feed
- Permalink
- Report Inappropriate Content
Thanks, But i have multiple charts which i would like to cover with textbox or image
- Mark as New
- Bookmark
- Subscribe
- Mute
- Subscribe to RSS Feed
- Permalink
- Report Inappropriate Content
Thanks all, But i have multiple charts which i would like to cover with textbox or image
- Mark as New
- Bookmark
- Subscribe
- Mute
- Subscribe to RSS Feed
- Permalink
- Report Inappropriate Content
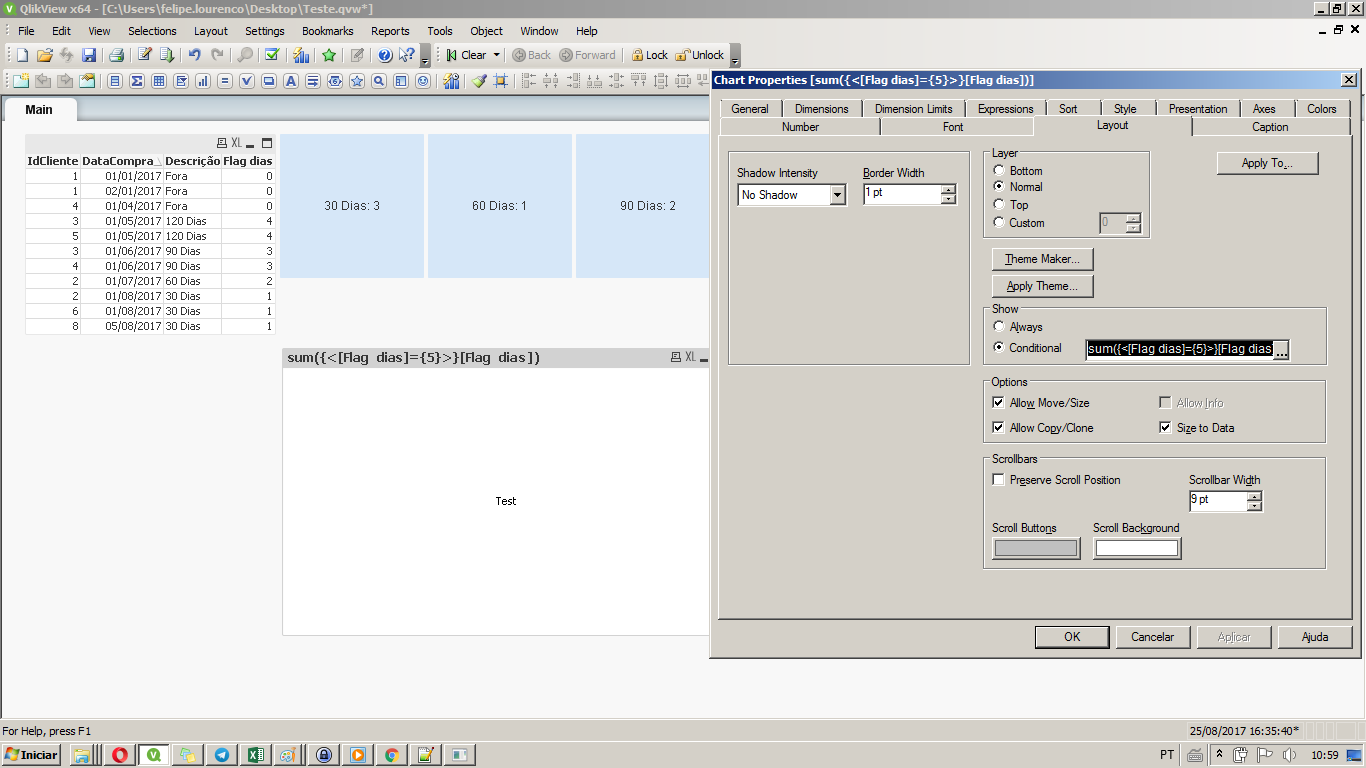
In text object properties -> Layout ->Conditional put below expression
= if(YourChartExpression <=0,1,0)
This text object will be visible when there no data for particular expression
- Mark as New
- Bookmark
- Subscribe
- Mute
- Subscribe to RSS Feed
- Permalink
- Report Inappropriate Content
Use the "Conditional" in Layout tab than.
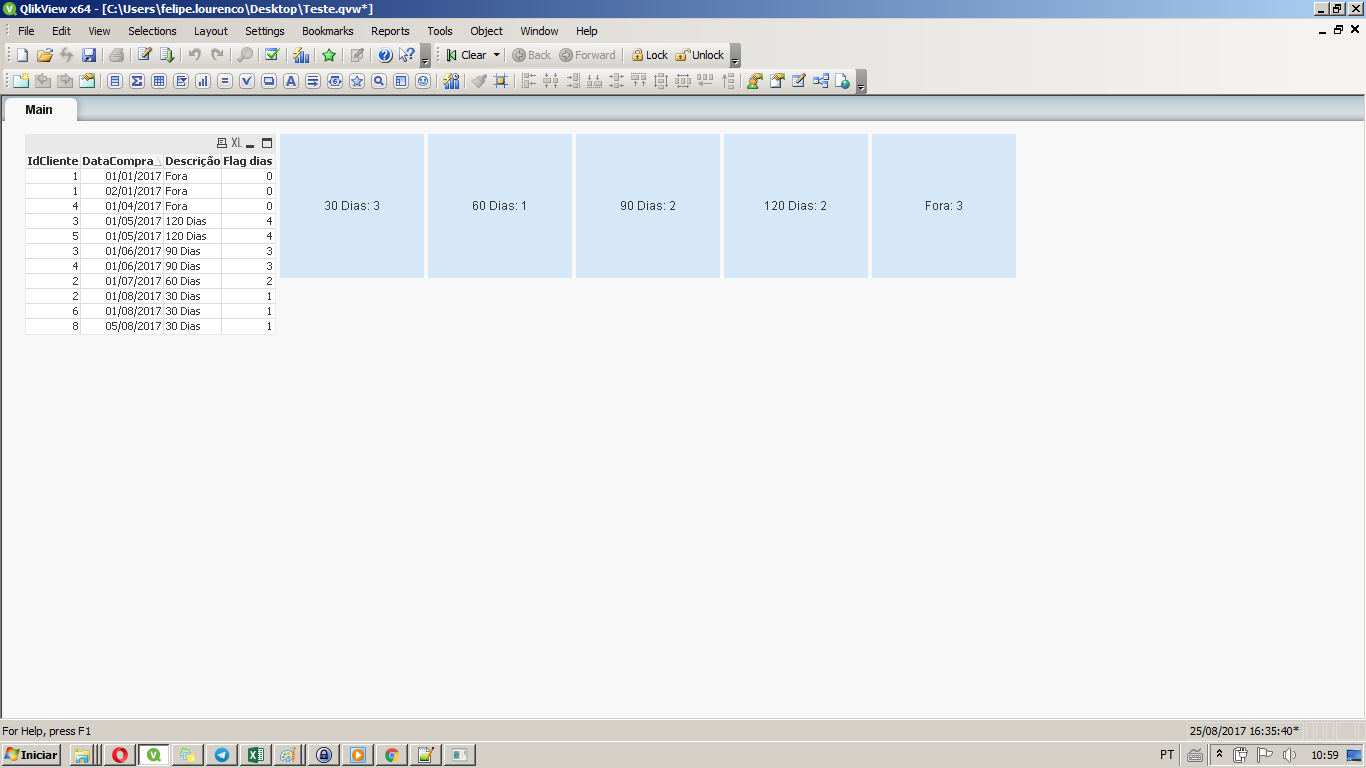
As you won't have a number on the calculation, the chart will not be displayed
In my case, i've tested with a set analysis that wont return a value to me
As i press the "OK" button, the chart disappears.
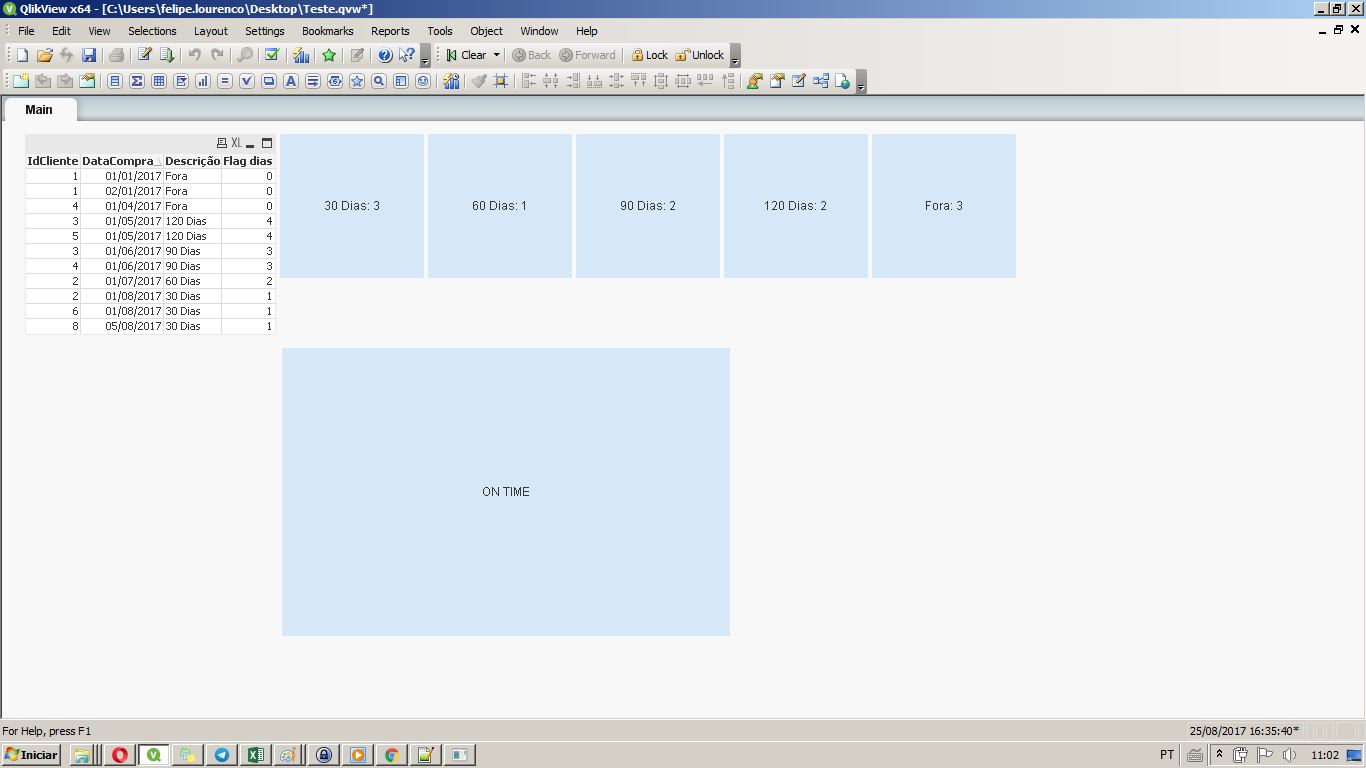
And putting a textbox behind the chart.
- Mark as New
- Bookmark
- Subscribe
- Mute
- Subscribe to RSS Feed
- Permalink
- Report Inappropriate Content
You can try the text box trick also.
See the attached also