Unlock a world of possibilities! Login now and discover the exclusive benefits awaiting you.
- Qlik Community
- :
- All Forums
- :
- QlikView App Dev
- :
- Re: Show Total Value on axis in Bar Chart
- Subscribe to RSS Feed
- Mark Topic as New
- Mark Topic as Read
- Float this Topic for Current User
- Bookmark
- Subscribe
- Mute
- Printer Friendly Page
- Mark as New
- Bookmark
- Subscribe
- Mute
- Subscribe to RSS Feed
- Permalink
- Report Inappropriate Content
Show Total Value on axis in Bar Chart
Hi Friends,
I m stuck off facing a problem. Actually i have created a Combo chart in real time which show YTD in bar , LYTD in bar and Grwth % in Line chart and also i have checked on total (In dimension limit tab).
What I want is to show the % value of Growth on axis instead on data points.
What i want here is as further to attached below screenshot its a dummy bar chart where i have to show the total value on axis as alike for data value shown for particular dimension. So, that the same can be implemented in real time Combo chart for Grwth % .
Any help will be appreciable.
Thanks & Regards
Mohit
- Mark as New
- Bookmark
- Subscribe
- Mute
- Subscribe to RSS Feed
- Permalink
- Report Inappropriate Content
Hi All,
Please help me in this to sort out this problem or please provide any alternative to solve this issue.
Thanks
Mohit
- Mark as New
- Bookmark
- Subscribe
- Mute
- Subscribe to RSS Feed
- Permalink
- Report Inappropriate Content
Please help me in this or is it a bug in qlikview that there is no way to show total on axis ????
- Mark as New
- Bookmark
- Subscribe
- Mute
- Subscribe to RSS Feed
- Permalink
- Report Inappropriate Content
Hi Mohit,
do you want this?
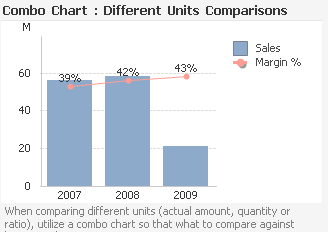
You can find it in Data Visualization file on examples in Qlikview start page, sheet Units.
Regards
Luca Jonathan Panetta
www.pljsoftware.com
- Mark as New
- Bookmark
- Subscribe
- Mute
- Subscribe to RSS Feed
- Permalink
- Report Inappropriate Content
Hi pljsoftware
Thanks for your response. Actually i have huge data on based of that my Grwth % vary from negative to positive or sometimes it comes on bar itself so, i can't show the % value on line itself thats why i want to show it on axis . please help me and also i m using the group on dimension side so, can't be used either text object or text in chart.
Thanks
Mohit
- Mark as New
- Bookmark
- Subscribe
- Mute
- Subscribe to RSS Feed
- Permalink
- Report Inappropriate Content
Hello Mohit,
try this example, I think can help you.
Here is used the DUAL function to set the position value for budget and previsionale.
The original post is here
http://qlikviewtips.wordpress.com/2011/10/19/combined-graphics-with-mixed-dimension/
Or you can use a double measure, % on top and value on bottom

Best Regards
Luca Jonathan Panetta
- Mark as New
- Bookmark
- Subscribe
- Mute
- Subscribe to RSS Feed
- Permalink
- Report Inappropriate Content
Hello Mohit,
this is for you

look this link Redundant dimension that adds more than 100% | QlikView Help, Tips & Hints
Regards
Luca Jonathan Panetta