Unlock a world of possibilities! Login now and discover the exclusive benefits awaiting you.
- Qlik Community
- :
- All Forums
- :
- QlikView App Dev
- :
- Re: Show all columns in calculated dimension
- Subscribe to RSS Feed
- Mark Topic as New
- Mark Topic as Read
- Float this Topic for Current User
- Bookmark
- Subscribe
- Mute
- Printer Friendly Page
- Mark as New
- Bookmark
- Subscribe
- Mute
- Subscribe to RSS Feed
- Permalink
- Report Inappropriate Content
Show all columns in calculated dimension
I have a calculated dimension in a pivot table as below:
=Aggr(If(avg(Aggr(Sum(force)/2),Name,ID)) <=100,'Low',
If(avg(Aggr(Sum(force)/2),Name,ID)) > 100 And avg(Aggr(Sum(force)/2),Name,ID)) <=300,'Medium',
If(avg(Aggr(Sum(force)/2),Name,ID)) > 300,'High'))),Name,ID)
It is working fine and shows the columns as Low, Medium and High when I have values for each. If I have values only for Medium then it shows only "Medium" column.
The question is how can I show all the three columns all the time regardless if it has a value or not.
Example:
Wrong:
Low Medium High
20
Correct: <--- This is how it should display
Low Medium High
0 20 0
Is this possible ?
Thanks
- « Previous Replies
- Next Replies »
- Mark as New
- Bookmark
- Subscribe
- Mute
- Subscribe to RSS Feed
- Permalink
- Report Inappropriate Content
Here is the updated example:
Example:
Wrong:
Medium
20
Correct: <--- This is how it should display
Low Medium High
0 20 0
Thanks
- Mark as New
- Bookmark
- Subscribe
- Mute
- Subscribe to RSS Feed
- Permalink
- Report Inappropriate Content
Hi,
Please make sure the below option is unchecked.
Dimensions -- Supress when value is Null.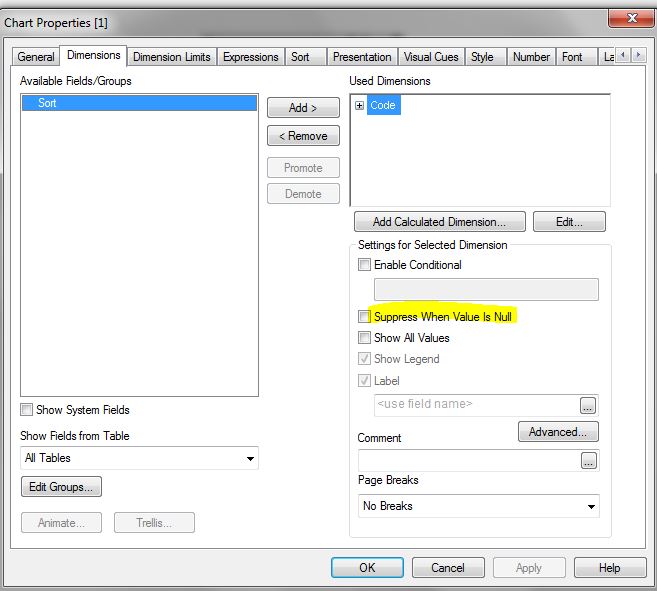
- Mark as New
- Bookmark
- Subscribe
- Mute
- Subscribe to RSS Feed
- Permalink
- Report Inappropriate Content
Check Show all values as well.
- Mark as New
- Bookmark
- Subscribe
- Mute
- Subscribe to RSS Feed
- Permalink
- Report Inappropriate Content
Probably not the "right" solution, and not even positive it would work, but how about using 0 as your null and missing symbols on the presentation tab o the chart?
- Mark as New
- Bookmark
- Subscribe
- Mute
- Subscribe to RSS Feed
- Permalink
- Report Inappropriate Content
No, It is not working.. Thanks
- Mark as New
- Bookmark
- Subscribe
- Mute
- Subscribe to RSS Feed
- Permalink
- Report Inappropriate Content
It is already unchecked... Thanks
- Mark as New
- Bookmark
- Subscribe
- Mute
- Subscribe to RSS Feed
- Permalink
- Report Inappropriate Content
it is greyed out... Thanks
- Mark as New
- Bookmark
- Subscribe
- Mute
- Subscribe to RSS Feed
- Permalink
- Report Inappropriate Content
right, I realized it doesn't appear active for calculated dimension.
Can you share your expression? One confusing point is on one side we want to show dimension based on condition result and contradicting to that we want to show all dimensions.
I was thinking Valuelist as a synthetic dimension can help here bcz that way all constant dimensions can be shown all the time and measures can be calculated in expression using Pick(match(Valuelist().
- Mark as New
- Bookmark
- Subscribe
- Mute
- Subscribe to RSS Feed
- Permalink
- Report Inappropriate Content
Below are the three expressions I am using:
Exp1:
# of Trips =Count(Name)
Exp2:
Used = Avg(Aggr(count({<Record={'XXX'}>} DISTINCT [Tripsused]),Name,ID))
Exp3:
Per_Day = avg(Aggr(Sum(force)/2),Name,ID))
Thanks
- « Previous Replies
- Next Replies »