Unlock a world of possibilities! Login now and discover the exclusive benefits awaiting you.
- Qlik Community
- :
- All Forums
- :
- QlikView App Dev
- :
- Re: Show only those rows which contain value...
- Subscribe to RSS Feed
- Mark Topic as New
- Mark Topic as Read
- Float this Topic for Current User
- Bookmark
- Subscribe
- Mute
- Printer Friendly Page
- Mark as New
- Bookmark
- Subscribe
- Mute
- Subscribe to RSS Feed
- Permalink
- Report Inappropriate Content
Show only those rows which contain value...
Hello all,
I have one problem can u please help me out.
my Question is:-
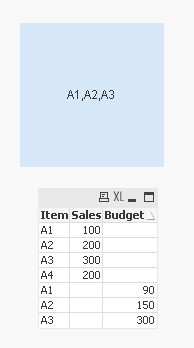
Item, Sales, Budget
A1, 100, --
A2, 200, --
A3, 300, --
A4, 200, --
A1, --, 90
A2, --, 150
A3, --, 300
Now I want to fetch the Items, whose Sales and Budget is presented.
The result should be: A1, A2, A3 [A4 – doesn’t have any budget].
thanks in advance.
- Tags:
- new_to_qlikview
Accepted Solutions
- Mark as New
- Bookmark
- Subscribe
- Mute
- Subscribe to RSS Feed
- Permalink
- Report Inappropriate Content
If You want to use within chart
LOAD all rows
in Chart Calculated Dimension
=Aggr(If(Sum(Sales) > 0 and Sum(Budget) > 0,Item),Item)

Regards,
Antonio
- Mark as New
- Bookmark
- Subscribe
- Mute
- Subscribe to RSS Feed
- Permalink
- Report Inappropriate Content
Try this in a text box object:
=Concat(DISTINCT {<Item = {"=Count({<Sales = {'*?'}>}Sales) = Count({<Budget = {'*?'}>}Budget)"}>} Item, ',')
Ouput:
HTH
Best,
Sunny
- Mark as New
- Bookmark
- Subscribe
- Mute
- Subscribe to RSS Feed
- Permalink
- Report Inappropriate Content
swuehl putting my new knowledge to work here  .
.
- Mark as New
- Bookmark
- Subscribe
- Mute
- Subscribe to RSS Feed
- Permalink
- Report Inappropriate Content
Hi,
if You want rows filtered in Script, try
LOAD *
Where Sales > 0 and Budget > 0;
LOAD DISTINCT
Item,Sum(Sales) as Sales,Sum(Budget) as Budget
Group By Item;
Load *
Inline [
Item, Sales, Budget
A1, 100, --
A2, 200, --
A3, 300, --
A4, 200, --
A1, --, 90
A2, --, 150
A3, --, 300
A5, --, 500
];
Regards,Antonio
- Mark as New
- Bookmark
- Subscribe
- Mute
- Subscribe to RSS Feed
- Permalink
- Report Inappropriate Content
If You want to use within chart
LOAD all rows
in Chart Calculated Dimension
=Aggr(If(Sum(Sales) > 0 and Sum(Budget) > 0,Item),Item)
Regards,
Antonio
- Mark as New
- Bookmark
- Subscribe
- Mute
- Subscribe to RSS Feed
- Permalink
- Report Inappropriate Content
Table:
load
Item,
Sales,
Budget
where Sales>0
and Budget>0
;
load
Item,
sum(Sales) as Sales,
sum(Budget) as Budget
Group by
Item
;
LOAD * Inline [
Item, Sales, Budget
A1, 100,
A2, 200,
A3, 300,
A4, 200,
A1, , 90
A2, , 150
A3, , 300
]
- Mark as New
- Bookmark
- Subscribe
- Mute
- Subscribe to RSS Feed
- Permalink
- Report Inappropriate Content
Another approach i would do is, load Item and Sales first where len(Sales)> 0 and load Item and Budget where len(Budget)>0. Then join those two tables. You will get the right data in the script itself.
- Mark as New
- Bookmark
- Subscribe
- Mute
- Subscribe to RSS Feed
- Permalink
- Report Inappropriate Content
=Concat(DISTINCT {<Item={"=sum(Sales)<>0"}*{"=sum(Budget)<>0"}>} Item, ',')
- Mark as New
- Bookmark
- Subscribe
- Mute
- Subscribe to RSS Feed
- Permalink
- Report Inappropriate Content
hii sunindia,
its not working in listbox...
i want to show required output in listbox insted of textbox...
thanks in advance...
- Mark as New
- Bookmark
- Subscribe
- Mute
- Subscribe to RSS Feed
- Permalink
- Report Inappropriate Content
Thanks for useful information ANTONIO MANCINI..
Thanks...