Unlock a world of possibilities! Login now and discover the exclusive benefits awaiting you.
- Qlik Community
- :
- All Forums
- :
- QlikView App Dev
- :
- Re: Showing calculated field for a predefined key ...
- Subscribe to RSS Feed
- Mark Topic as New
- Mark Topic as Read
- Float this Topic for Current User
- Bookmark
- Subscribe
- Mute
- Printer Friendly Page
- Mark as New
- Bookmark
- Subscribe
- Mute
- Subscribe to RSS Feed
- Permalink
- Report Inappropriate Content
Showing calculated field for a predefined key value
Hello,
I have a table with the count of subscribers for a specific flow_id in a specific run_id.
for each flow_id I have several 'Opcodes' (can repeat themselves).
I created another table that for each flow and existing opcode gives the count of this opcode for a specific flow.
Now, I want to show this result: opcode_count(for each opcode) * subscriber_count (for the corresponding flow), BUT, I want to set
the RUN_ID to a specific value on this sheet, without the ability of the user to change it.
How can I do that? it works with a simple expressions, but in order to fix the run Id I need set analysis but the expression does not require any aggregations.
will be glad for some help.
Accepted Solutions
- Mark as New
- Bookmark
- Subscribe
- Mute
- Subscribe to RSS Feed
- Permalink
- Report Inappropriate Content
In qlikview every expression is aggregated. If you don't specify one then the only() function is used. And the only function also accepts set modifiers: only({<RUN_ID={'ValueX'}>} SomeThing )
talk is cheap, supply exceeds demand
- Mark as New
- Bookmark
- Subscribe
- Mute
- Subscribe to RSS Feed
- Permalink
- Report Inappropriate Content
Thanks!
Another question.
now I have an aggregated table:
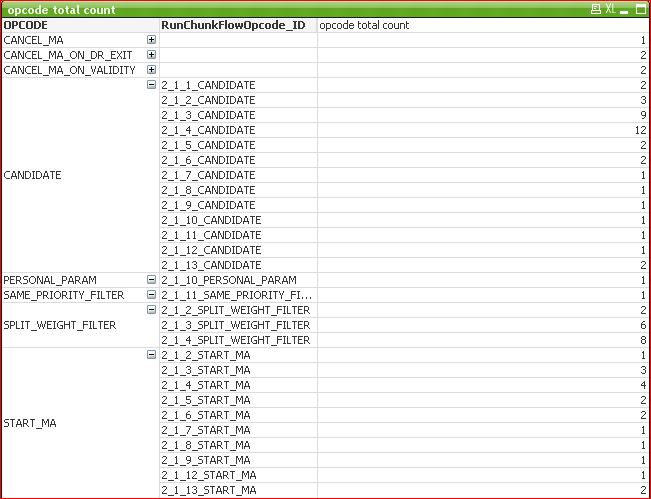
I need the sum of 'opcode_total_count' for each opcode.
how is it done?
Thanks,
- Mark as New
- Bookmark
- Subscribe
- Mute
- Subscribe to RSS Feed
- Permalink
- Report Inappropriate Content
Depends. If you want subtotals in the pivot table you can enable partial sums for the RunChunkFlowOpcode_ID dimension on the Presentation tab of the properties window of the pivot table.
talk is cheap, supply exceeds demand
- Mark as New
- Bookmark
- Subscribe
- Mute
- Subscribe to RSS Feed
- Permalink
- Report Inappropriate Content
I would like in the end to show a graph where the dimension is the OPCODE
and the expression is the SUM of the opcode_total_count per opcode from this table.
- Mark as New
- Bookmark
- Subscribe
- Mute
- Subscribe to RSS Feed
- Permalink
- Report Inappropriate Content
Based on your information so far I think this would work: sum({<RUN_ID={'ValueX'}>} opcode_count * subscriber_count)
If not try posting a sample application: Preparing examples for Upload - Reduction and Data Scrambling
talk is cheap, supply exceeds demand
- Mark as New
- Bookmark
- Subscribe
- Mute
- Subscribe to RSS Feed
- Permalink
- Report Inappropriate Content
already tried it, the calculation is wrong, this is the outcome:
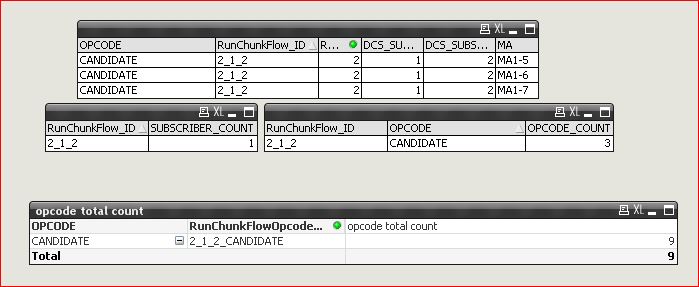
The total should be 3, not 9.