Unlock a world of possibilities! Login now and discover the exclusive benefits awaiting you.
- Qlik Community
- :
- All Forums
- :
- QlikView App Dev
- :
- Re: Showing data for today() but display sunday's ...
- Subscribe to RSS Feed
- Mark Topic as New
- Mark Topic as Read
- Float this Topic for Current User
- Bookmark
- Subscribe
- Mute
- Printer Friendly Page
- Mark as New
- Bookmark
- Subscribe
- Mute
- Subscribe to RSS Feed
- Permalink
- Report Inappropriate Content
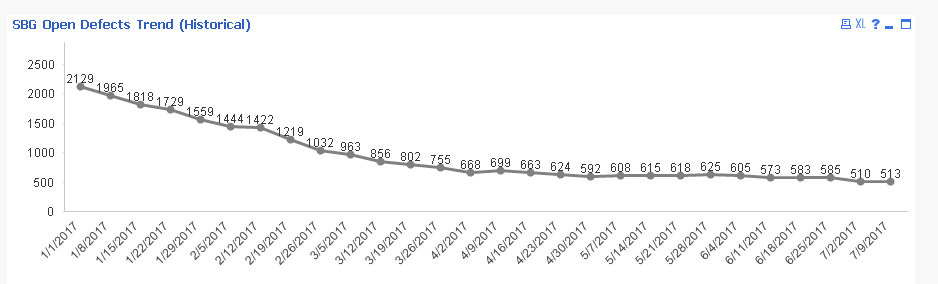
Showing data for today() but display sunday's date on axis
Hi
Please take a look at the attached application .. i am trying to plot data of sundays on x-axis , the data is stored for each day in the table , but need to show weekly data in chart , is there a way that i could show future weekend date(sunday - 7/9) on x-axis but display max date ( today()) data ?
Thanks!
Accepted Solutions
- Mark as New
- Bookmark
- Subscribe
- Mute
- Subscribe to RSS Feed
- Permalink
- Report Inappropriate Content
May be this ?
Change your dimension to:
=if(weekday(OpenDefects_EventDate)='Sun',Date(OpenDefects_EventDate), Date(WeekEnd(Today())))
Expression to:
= if(weekday(OpenDefects_EventDate) = 'Sun',Sum({<OpenDefects_Segment = P({<Trends_Priority, Trends_L1>} Trends_Segment), OpenDefects_ScrumTeam = P({<Trends_Priority, Trends_L1>} Trends_ScrumTeam)>} Total_SLAviolated_Bugs),
sum(if(OpenDefects_EventDate = today(), Total_SLAviolated_Bugs)))
- Mark as New
- Bookmark
- Subscribe
- Mute
- Subscribe to RSS Feed
- Permalink
- Report Inappropriate Content
Thank you!