Unlock a world of possibilities! Login now and discover the exclusive benefits awaiting you.
- Qlik Community
- :
- All Forums
- :
- QlikView App Dev
- :
- Re: Showing month on month growth
- Subscribe to RSS Feed
- Mark Topic as New
- Mark Topic as Read
- Float this Topic for Current User
- Bookmark
- Subscribe
- Mute
- Printer Friendly Page
- Mark as New
- Bookmark
- Subscribe
- Mute
- Subscribe to RSS Feed
- Permalink
- Report Inappropriate Content
Showing month on month growth
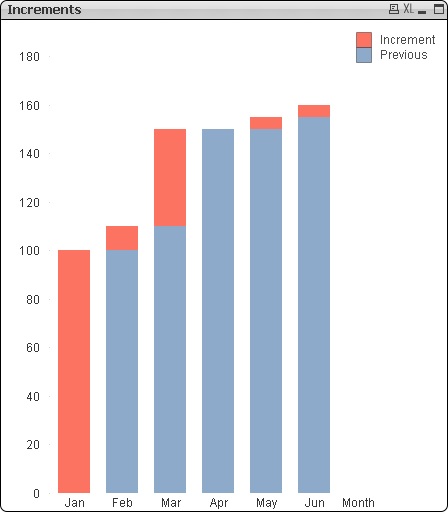
I'm trying to develop a Qlikview chart that shows the increase in the number of users every month over the previous month. I'm using a bar chart for this.
For example, I have a total of 10 users in June and 20 users in July and 30 users in August.
The bar for July will consist of 2 sections. The lower half will be equal to the height of June's bar and the upper half indicates the additional 10 users that were added in July. Similarly the lower part of the bar for August will be equal in height to that of July. The upper part will indicate the additional 10 users added in August.
My data-source is a database table where I can list the no. of users added per day.
I was trying to do this using a vertical stacked bar chart for this, but couldn't get around to representing the data this way.
Any pointers would be much appreciated.
Thanks!
Accepted Solutions
- Mark as New
- Bookmark
- Subscribe
- Mute
- Subscribe to RSS Feed
- Permalink
- Report Inappropriate Content
- Mark as New
- Bookmark
- Subscribe
- Mute
- Subscribe to RSS Feed
- Permalink
- Report Inappropriate Content
Would you be able to provide your data in an Excel file with the expected output to help you better?
- Mark as New
- Bookmark
- Subscribe
- Mute
- Subscribe to RSS Feed
- Permalink
- Report Inappropriate Content
I've attached some sample data showing the no. of new users added each month.
Also, I've attached an image of the kind of chart I'm trying to generate.
Please let me know if you have any suggestions.
Thanks!
- Mark as New
- Bookmark
- Subscribe
- Mute
- Subscribe to RSS Feed
- Permalink
- Report Inappropriate Content
What should happen when there are fewer users in October than in September?
- Mark as New
- Bookmark
- Subscribe
- Mute
- Subscribe to RSS Feed
- Permalink
- Report Inappropriate Content
Like this?

- Mark as New
- Bookmark
- Subscribe
- Mute
- Subscribe to RSS Feed
- Permalink
- Report Inappropriate Content
Yes, that's pretty much how I want the chart to look. It doesn't matter if the no. of users in October is lesser than that in September. I'm just trying to show the total number of users until the previous month and the increment from the current month.
- Mark as New
- Bookmark
- Subscribe
- Mute
- Subscribe to RSS Feed
- Permalink
- Report Inappropriate Content
Well, see the attachment then...
- Mark as New
- Bookmark
- Subscribe
- Mute
- Subscribe to RSS Feed
- Permalink
- Report Inappropriate Content
Actually, there is a slight difference in the data model I provided to the one in the qvd file you sent me.
The user count column for each month lists the number of new users added for that month.
Taking the example in your qvd file, this is what it would look like.
Month, UserCount
Jan, 100
Feb, 10
Mar, 40
Apr, 0
May, 5
Jun, 5
Any idea how the expressions would change so that the bar chart looks the same as the one provided ?
- Mark as New
- Bookmark
- Subscribe
- Mute
- Subscribe to RSS Feed
- Permalink
- Report Inappropriate Content
Use these expressions tp aggregate increments instead of total counts:
=RangeSum(above(sum(UserCount), 1, 12)) // Previous
=sum(UserCount) // Increment
You'll get a display like this:
See the attachment for a working example that uses your data
Best,
Peter
- Mark as New
- Bookmark
- Subscribe
- Mute
- Subscribe to RSS Feed
- Permalink
- Report Inappropriate Content
Thanks! That works for me.