Unlock a world of possibilities! Login now and discover the exclusive benefits awaiting you.
- Qlik Community
- :
- All Forums
- :
- QlikView App Dev
- :
- Re: Showing previous 12 months data in graph on si...
- Subscribe to RSS Feed
- Mark Topic as New
- Mark Topic as Read
- Float this Topic for Current User
- Bookmark
- Subscribe
- Mute
- Printer Friendly Page
- Mark as New
- Bookmark
- Subscribe
- Mute
- Subscribe to RSS Feed
- Permalink
- Report Inappropriate Content
Showing previous 12 months data in graph on single selection in Month Filter
Hi,
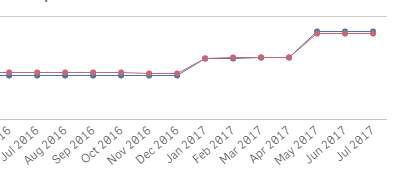
We have a requirement in Qliksense where on selection of any month in month filter it should show previous 12 months data in the graph
for example if we select Jul 2017 it should show from Jul 2016 to Jul 2017 as shown below
Needed help to acheive this requirement
Regards,
Bhargav
- Tags:
- previous 12 months
Accepted Solutions
- Mark as New
- Bookmark
- Subscribe
- Mute
- Subscribe to RSS Feed
- Permalink
- Report Inappropriate Content
Is there any challenge you faced using?
Sum({<MonthYear = {">=$(=AddYears(Max(MonthYear), -1)) <=$(=Max(MonthYear))"}>} Sales)
- Mark as New
- Bookmark
- Subscribe
- Mute
- Subscribe to RSS Feed
- Permalink
- Report Inappropriate Content
Is there any challenge you faced using?
Sum({<MonthYear = {">=$(=AddYears(Max(MonthYear), -1)) <=$(=Max(MonthYear))"}>} Sales)
- Mark as New
- Bookmark
- Subscribe
- Mute
- Subscribe to RSS Feed
- Permalink
- Report Inappropriate Content
He might have to make sure that the formatting within the set analysis is right and also make sure to not have spaces between ranges....So what I mean is this
Have this
>=blahblah<=blahblah
Instead of
>=blahblah <=blahblah
- Mark as New
- Bookmark
- Subscribe
- Mute
- Subscribe to RSS Feed
- Permalink
- Report Inappropriate Content
is there no need of changing to 'MMM YYYY' format?
- Mark as New
- Bookmark
- Subscribe
- Mute
- Subscribe to RSS Feed
- Permalink
- Report Inappropriate Content
Hi Anil,
As per requirement,we do not have to sum up the 12 months data . we just need to have data in graph for previous 12 months in graph.The issue is that on selection of a month in month filter it shows data for single month only in graph
Regards,
Bhargav
- Mark as New
- Bookmark
- Subscribe
- Mute
- Subscribe to RSS Feed
- Permalink
- Report Inappropriate Content
May be Only() helps here
Only({1<MonthYear = {">=$(=AddYears(Max(MonthYear), -1))<=$(=Max(MonthYear))"}>} Dimension)
Update - As suggest by sunny
- Mark as New
- Bookmark
- Subscribe
- Mute
- Subscribe to RSS Feed
- Permalink
- Report Inappropriate Content
When you say Month is it the same field as your dimension? which include Month and Year or is this a separate field from MonthYear? Can you share the name of your fields? and the expression you are using right now?
- Mark as New
- Bookmark
- Subscribe
- Mute
- Subscribe to RSS Feed
- Permalink
- Report Inappropriate Content
I believe, He can manage with Format or he will surf in google 
- Mark as New
- Bookmark
- Subscribe
- Mute
- Subscribe to RSS Feed
- Permalink
- Report Inappropriate Content
Hi Sunny,
Thanks for Replying
The expression is working fine in the graph
Regards,
Bhargav