Unlock a world of possibilities! Login now and discover the exclusive benefits awaiting you.
- Qlik Community
- :
- All Forums
- :
- QlikView App Dev
- :
- Re: Showing revenue depending on 2 different date-...
- Subscribe to RSS Feed
- Mark Topic as New
- Mark Topic as Read
- Float this Topic for Current User
- Bookmark
- Subscribe
- Mute
- Printer Friendly Page
- Mark as New
- Bookmark
- Subscribe
- Mute
- Subscribe to RSS Feed
- Permalink
- Report Inappropriate Content
Showing revenue depending on 2 different date-fields in a bar chart
Hello community
This is my table
| order_id | order_date | delivery_date | revenue |
|---|---|---|---|
| 1001 | 20.01.2018 | 21.01.2018 | 100 |
| 1002 | 20.01.2018 | 21.01.2018 | 100 |
| 1003 | 27.01.2018 | 29.01.2018 | 200 |
| 1004 | 27.01.2018 | 29.01.2018 | 200 |
| 1005 | 31.01.2018 | 01.02.2018 | 300 |
| 1006 | 31.01.2018 | 01.02.2018 | 300 |
| 1007 | 25.02.2018 | 27.02.2018 | 100 |
| 1008 | 26.02.2018 | 28.02.2018 | 100 |
| 1009 | 28.02.2018 | 01.03.2018 | 200 |
| 1010 | 15.03.2018 | 15.03.2018 | 500 |
| 1011 | 30.03.2018 | 31.03.2018 | 200 |
| 1012 | 31.03.2018 | 01.04.2018 | 100 |
Target:
Showing revenue per month with delivery_date considering the order_date in a bar chart
Dimension:
order_date (Main dimension)
delivery_date
KPI:
sum(revenue)
How it should be calculated:
| Jan | Fev | Mar | ||
|---|---|---|---|---|
| Revenue by order_date | 1200 | 400 | 800 | |
| revenue by delivery_date | 600 | 800 | 900 |
How it should look like at the end (ignoring avril). The main dimension is delivery_date:
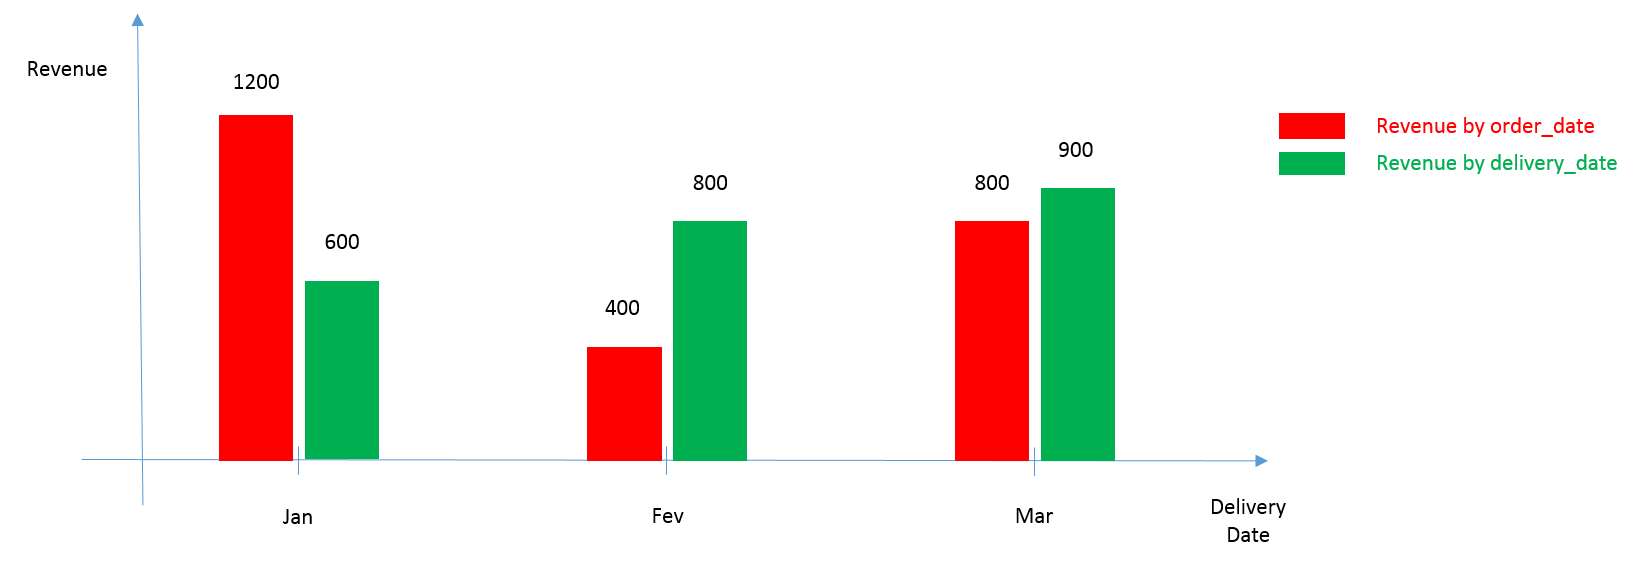
Hope anyone can really understand what I'm trying to say.
- « Previous Replies
-
- 1
- 2
- Next Replies »
Accepted Solutions
- Mark as New
- Bookmark
- Subscribe
- Mute
- Subscribe to RSS Feed
- Permalink
- Report Inappropriate Content
I would suggest on the similar lines, but instead of duplicating all fact table rows, do this duplication in a separate table.... I called it Bridge_Table, but its a concept similar to Canonical Date
revenue:
LOAD * INLINE [
order_id, order_date, delivery_date, revenue
1001, 20.01.2018, 21.01.2018, 100
1002, 20.01.2018, 21.01.2018, 100
1003, 27.01.2018, 29.01.2018, 200
1004, 27.01.2018, 29.01.2018, 200
1005, 31.01.2018, 01.02.2018, 300
1006, 31.01.2018, 01.02.2018, 300
1007, 25.02.2018, 27.02.2018, 100
1008, 26.02.2018, 28.02.2018, 100
1009, 28.02.2018, 01.03.2018, 200
1010, 15.03.2018, 15.03.2018, 500
1011, 30.03.2018, 31.03.2018, 200
1012, 31.03.2018, 01.04.2018, 100
];
Bridge_Table:
LOAD order_id,
order_date as Date,
'order' as Flag
Resident revenue;
Concatenate (Bridge_Table)
LOAD order_id,
delivery_date as Date,
'delivery' as Flag
Resident revenue;
- Mark as New
- Bookmark
- Subscribe
- Mute
- Subscribe to RSS Feed
- Permalink
- Report Inappropriate Content
Hi,
here is one way to do it:
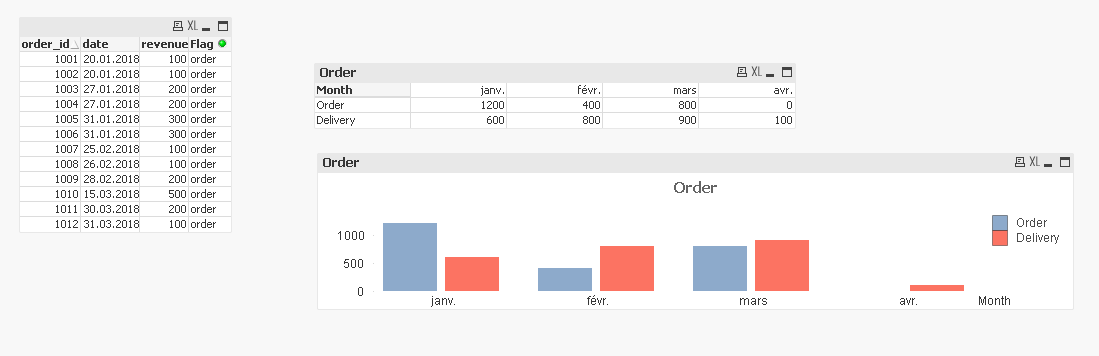
PFA
- Mark as New
- Bookmark
- Subscribe
- Mute
- Subscribe to RSS Feed
- Permalink
- Report Inappropriate Content
Hello youssef,
thanks for your response.
I actually don't understand for what die column "Flag" is for and how you managed to visualize the bar chart. Did you use the set analysis function?
- Mark as New
- Bookmark
- Subscribe
- Mute
- Subscribe to RSS Feed
- Permalink
- Report Inappropriate Content
Oh I didn't see the attached file. Is there no other solution besides creating an independant date?
- Mark as New
- Bookmark
- Subscribe
- Mute
- Subscribe to RSS Feed
- Permalink
- Report Inappropriate Content
I'm sure there is other solutions for this..
Maybe stalwar1 can give a second option here ?
- Mark as New
- Bookmark
- Subscribe
- Mute
- Subscribe to RSS Feed
- Permalink
- Report Inappropriate Content
The island date field is one way. Or you can connect the two date fields to a canonical calendar, which is very well explained here: Canonical Date
- Mark as New
- Bookmark
- Subscribe
- Mute
- Subscribe to RSS Feed
- Permalink
- Report Inappropriate Content
I would suggest on the similar lines, but instead of duplicating all fact table rows, do this duplication in a separate table.... I called it Bridge_Table, but its a concept similar to Canonical Date
revenue:
LOAD * INLINE [
order_id, order_date, delivery_date, revenue
1001, 20.01.2018, 21.01.2018, 100
1002, 20.01.2018, 21.01.2018, 100
1003, 27.01.2018, 29.01.2018, 200
1004, 27.01.2018, 29.01.2018, 200
1005, 31.01.2018, 01.02.2018, 300
1006, 31.01.2018, 01.02.2018, 300
1007, 25.02.2018, 27.02.2018, 100
1008, 26.02.2018, 28.02.2018, 100
1009, 28.02.2018, 01.03.2018, 200
1010, 15.03.2018, 15.03.2018, 500
1011, 30.03.2018, 31.03.2018, 200
1012, 31.03.2018, 01.04.2018, 100
];
Bridge_Table:
LOAD order_id,
order_date as Date,
'order' as Flag
Resident revenue;
Concatenate (Bridge_Table)
LOAD order_id,
delivery_date as Date,
'delivery' as Flag
Resident revenue;
- Mark as New
- Bookmark
- Subscribe
- Mute
- Subscribe to RSS Feed
- Permalink
- Report Inappropriate Content
Thanks 
- Mark as New
- Bookmark
- Subscribe
- Mute
- Subscribe to RSS Feed
- Permalink
- Report Inappropriate Content
Thanks jontydkpi
- Mark as New
- Bookmark
- Subscribe
- Mute
- Subscribe to RSS Feed
- Permalink
- Report Inappropriate Content
one last thing here stalwar1, If I don't want or can't create another Date field.. Is it possible with some dimension expression and set analysis to use these original dates (order and delivery) and get the OP's expected output ?
- « Previous Replies
-
- 1
- 2
- Next Replies »