Unlock a world of possibilities! Login now and discover the exclusive benefits awaiting you.
- Qlik Community
- :
- All Forums
- :
- QlikView App Dev
- :
- Sort a bar chart based on 2 fields not already in ...
- Subscribe to RSS Feed
- Mark Topic as New
- Mark Topic as Read
- Float this Topic for Current User
- Bookmark
- Subscribe
- Mute
- Printer Friendly Page
- Mark as New
- Bookmark
- Subscribe
- Mute
- Subscribe to RSS Feed
- Permalink
- Report Inappropriate Content
Sort a bar chart based on 2 fields not already in the chart
Hi all,
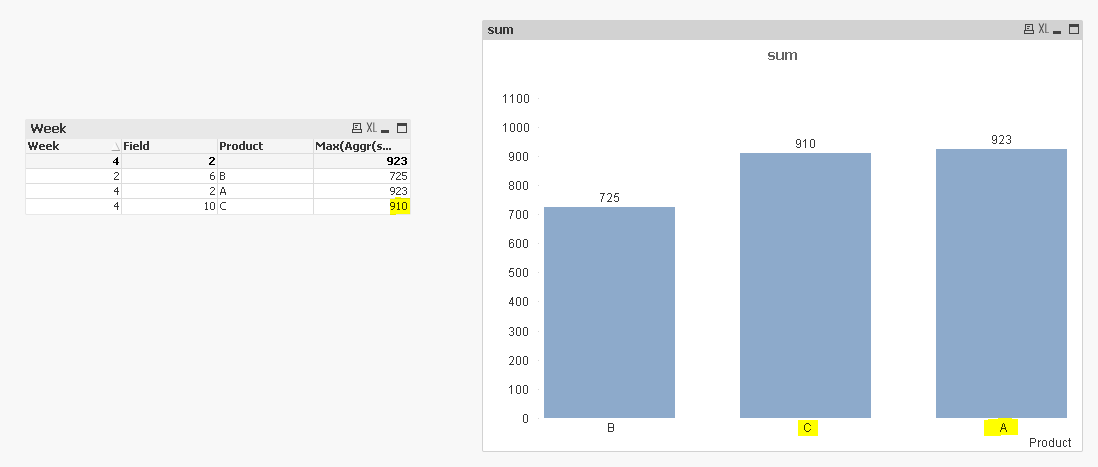
I am trying to sort a bar chart based on 2 fields - Week & Field. As you can see in the table below, it is sorted based on the fields Week & Field, of course I could achieve this because I included the two fields in the table (as expressions) and sorted. Here's my question - Is it possible to sort the bar chart just like in the table?
I've attached a sample qvw.


Accepted Solutions
- Mark as New
- Bookmark
- Subscribe
- Mute
- Subscribe to RSS Feed
- Permalink
- Report Inappropriate Content
Sort using this
=FirstSortedValue(Week*1000 + Field, -Aggr(Sum(value), Product, Week, Field))
- Mark as New
- Bookmark
- Subscribe
- Mute
- Subscribe to RSS Feed
- Permalink
- Report Inappropriate Content
- Mark as New
- Bookmark
- Subscribe
- Mute
- Subscribe to RSS Feed
- Permalink
- Report Inappropriate Content
Hi Clever Anjos,
Thank you for the response.
This actually sorts based on the expression and not based on Week & Field.
If I changed the value of (Product=C, Week=4, Field=10) from 999 to 910, then the sorting changes in the chart

But you see that the sorting in the table remains the same because the table has been sorted based on Week & Field, which I am looking for.
Any thoughts?
- Mark as New
- Bookmark
- Subscribe
- Mute
- Subscribe to RSS Feed
- Permalink
- Report Inappropriate Content
Sort using this
=FirstSortedValue(Week*1000 + Field, -Aggr(Sum(value), Product, Week, Field))
- Mark as New
- Bookmark
- Subscribe
- Mute
- Subscribe to RSS Feed
- Permalink
- Report Inappropriate Content
Hi Sunny,
This works. Thank you.