Unlock a world of possibilities! Login now and discover the exclusive benefits awaiting you.
- Qlik Community
- :
- All Forums
- :
- QlikView App Dev
- :
- Sort by expression or calculated dimension?
- Subscribe to RSS Feed
- Mark Topic as New
- Mark Topic as Read
- Float this Topic for Current User
- Bookmark
- Subscribe
- Mute
- Printer Friendly Page
- Mark as New
- Bookmark
- Subscribe
- Mute
- Subscribe to RSS Feed
- Permalink
- Report Inappropriate Content
Sort by expression or calculated dimension?
Hi!
I'm quite new to QlickView, and I'm unable to find how to sort by expression or to create a relevant calculated dimension to do it.
My data are the following one: I have a pivot table listing some fields used in an IT system for many banks, and not all banks use the same fields. I would like, for each field, have a column indicating if each bank uses it or not, and at the end count how many banks use it.
I was able to either use a calculated dimension or an expression to flag if each bank use it (value 1, calculated this way:
=if(BU_PUBLIC_CLASS='X',1,0)
I was able to have the sum with the following expression:
TOTAL_VISIB=sum(if(BU_PUBLIC_CLASS='X',1,0)+if(BDL_LU_CLASS='X',1,0)+if(BDL_BE_CLASS='X',1,0)+if(CIC_CH_CLASS='X',1,0)+if(BTB_CLASS='X',1,0)+if(BTL_CLASS='X',1,0)+if(CIC_SG_CLASS
='X',1,0))
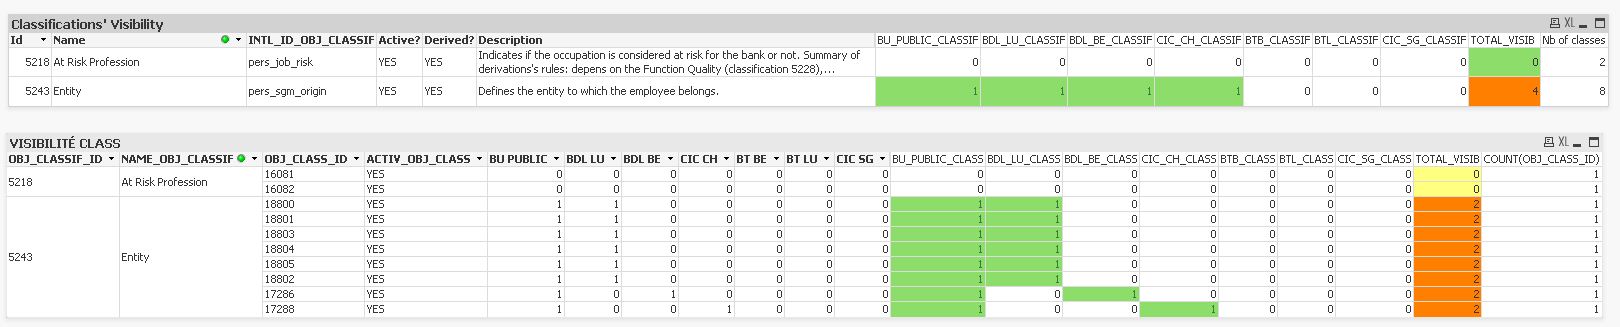
but how can I select only the OBJ_CLASS_ID whose TOTAL_VISIB > 0? I want to be able to do a dropdown select if possible...
Thank you very much for your help!