Unlock a world of possibilities! Login now and discover the exclusive benefits awaiting you.
- Qlik Community
- :
- All Forums
- :
- QlikView App Dev
- :
- Re: Sorting Issue
- Subscribe to RSS Feed
- Mark Topic as New
- Mark Topic as Read
- Float this Topic for Current User
- Bookmark
- Subscribe
- Mute
- Printer Friendly Page
- Mark as New
- Bookmark
- Subscribe
- Mute
- Subscribe to RSS Feed
- Permalink
- Report Inappropriate Content
Sorting Issue
Hi Friends
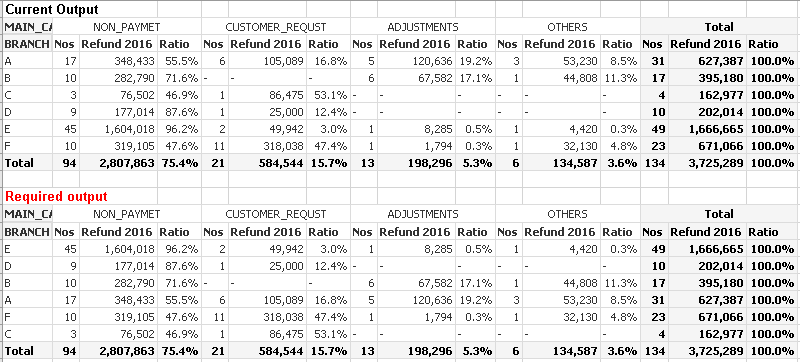
I have folowing pivot Table in my QV doc.

My current output is shown in first statment and required report is shown below. In fact I want to sort my report (branch Column)as per ratio colum under Non_payment catagory. I have tried with follwing expresion in sort tab. But it does not work. Pls help me.

Accepted Solutions
- Mark as New
- Bookmark
- Subscribe
- Mute
- Subscribe to RSS Feed
- Permalink
- Report Inappropriate Content
I made a short sample
I defined the sort for Dimension branch to "=sum({<Main_Cat={'Non-Payment'}>}Refund)/sum (total BRANCH> Refund)
it's sorted by Ratio of non-payment

- Mark as New
- Bookmark
- Subscribe
- Mute
- Subscribe to RSS Feed
- Permalink
- Report Inappropriate Content
does the Pivot table show "NON_PAYMET" instead of "NON_PAYMENT" in MAIN_CATEGORY?
- Mark as New
- Bookmark
- Subscribe
- Mute
- Subscribe to RSS Feed
- Permalink
- Report Inappropriate Content
Yes Rudolf,
I have made a mistake there. I have corrected it still the report is not what I want .. Pls help

- Mark as New
- Bookmark
- Subscribe
- Mute
- Subscribe to RSS Feed
- Permalink
- Report Inappropriate Content
can you post qvw?
how Comes that branch A now has total of NOS=49 and Refund2016 = 1666665
in required ouptput branch a has total of NOS=31 and refund2016 = 626387?
no branch Shows the same figures like in your first post
- Mark as New
- Bookmark
- Subscribe
- Mute
- Subscribe to RSS Feed
- Permalink
- Report Inappropriate Content
Yes What you say is correct. I am not in a position to share the Qv file. If you go by my last report forgetting the earlier one it is sorted on Value Column and not % column. Can you suggest me a way to sort it according to Ratio. Pls help.
- Mark as New
- Bookmark
- Subscribe
- Mute
- Subscribe to RSS Feed
- Permalink
- Report Inappropriate Content
Hi,
you only need to repeat (copy & paste) exactly the expression used for the Ratio within the sorting option for BRANCH.
Peter
- Mark as New
- Bookmark
- Subscribe
- Mute
- Subscribe to RSS Feed
- Permalink
- Report Inappropriate Content
I made a short sample
I defined the sort for Dimension branch to "=sum({<Main_Cat={'Non-Payment'}>}Refund)/sum (total BRANCH> Refund)
it's sorted by Ratio of non-payment
