Unlock a world of possibilities! Login now and discover the exclusive benefits awaiting you.
- Qlik Community
- :
- All Forums
- :
- QlikView App Dev
- :
- Sorting in Line Chart
- Subscribe to RSS Feed
- Mark Topic as New
- Mark Topic as Read
- Float this Topic for Current User
- Bookmark
- Subscribe
- Mute
- Printer Friendly Page
- Mark as New
- Bookmark
- Subscribe
- Mute
- Subscribe to RSS Feed
- Permalink
- Report Inappropriate Content
Sorting in Line Chart
Hi All,
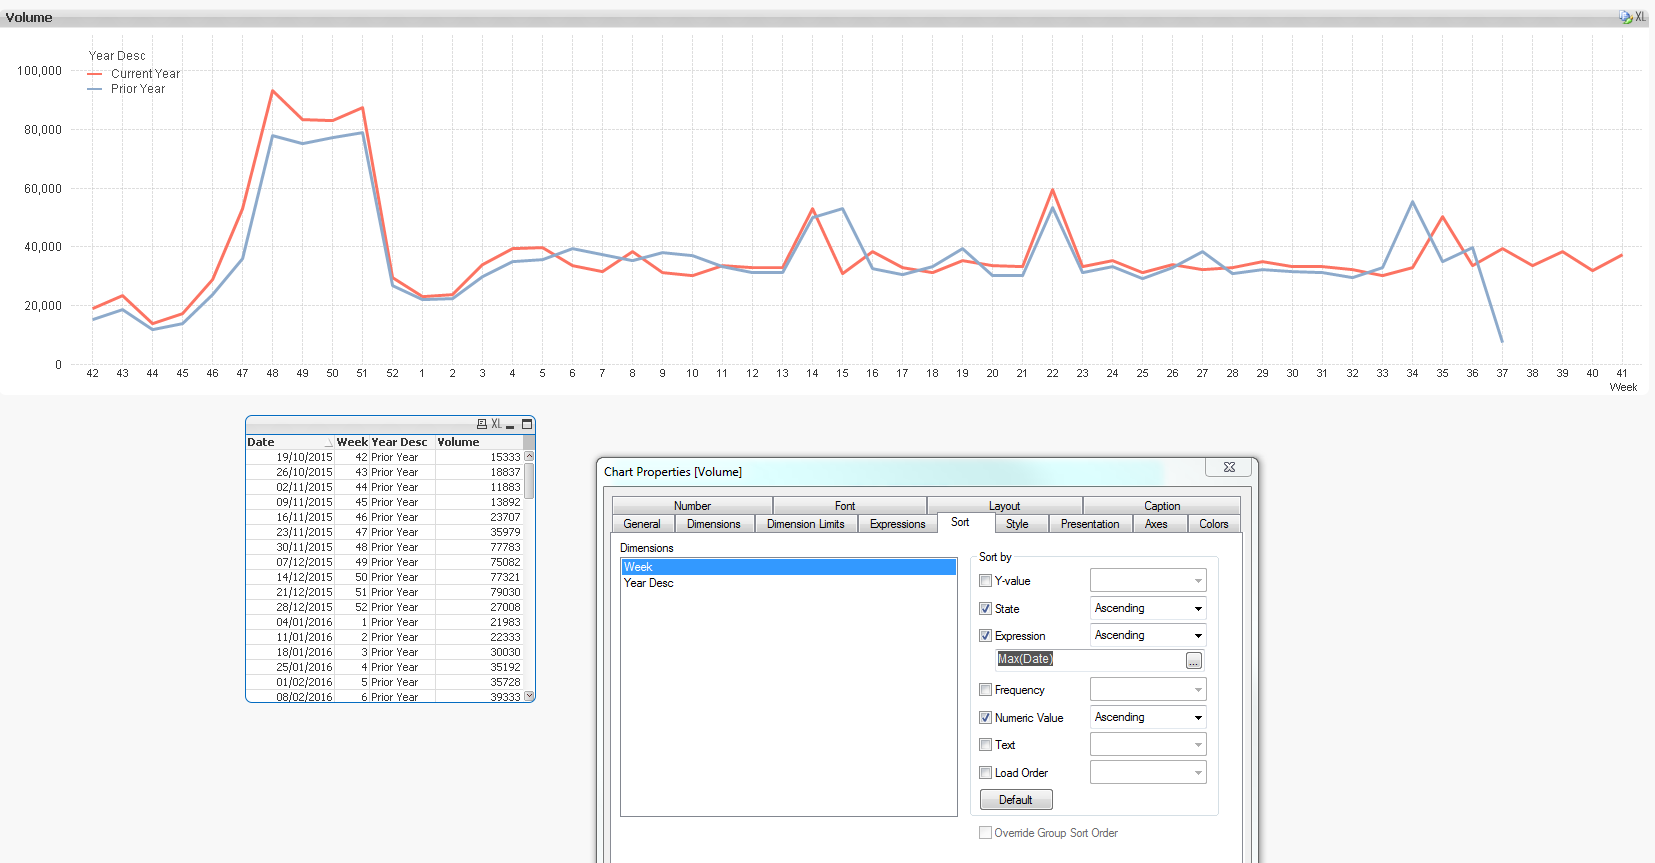
i am trying to get a line chart sorted as per the following..
i have week number on my x axis which is currently sorted numerically (1-52) but what i want is to sort it based on the last date that data was received.
The last date is 09/10/2017 which is week 41, so i want the chart to start at week 42 and end at 41.
can anyone help please?
i have attached an example.
Thanks 
- « Previous Replies
-
- 1
- 2
- Next Replies »
Accepted Solutions
- Mark as New
- Bookmark
- Subscribe
- Mute
- Subscribe to RSS Feed
- Permalink
- Report Inappropriate Content
Try this
=Max({<MAT_Year = {'Current Year (MAT)'}>}nd_CALENDAR_YYYYMMDD)

- Mark as New
- Bookmark
- Subscribe
- Mute
- Subscribe to RSS Feed
- Permalink
- Report Inappropriate Content
Try sorting by Max(Date) (Asc or Desc)
- Mark as New
- Bookmark
- Subscribe
- Mute
- Subscribe to RSS Feed
- Permalink
- Report Inappropriate Content
May be use Calc. Dimension for Week like
=If(Week >= $(vMaxEndDate), Week)
- Mark as New
- Bookmark
- Subscribe
- Mute
- Subscribe to RSS Feed
- Permalink
- Report Inappropriate Content
this is the first thing i tried (and the obvious one) but it doesnt work in my live qvw!
this might be difficult for me get help with then as i cant upload my live version.
i see it works in my sample though..
- Mark as New
- Bookmark
- Subscribe
- Mute
- Subscribe to RSS Feed
- Permalink
- Report Inappropriate Content
What is different between this sample and live version? Set Analysis? calculated dimension? anything else?
- Mark as New
- Bookmark
- Subscribe
- Mute
- Subscribe to RSS Feed
- Permalink
- Report Inappropriate Content
No calculated dimensions and no set analysis. the only difference is the data model.
there are some synthetic keys which i will sort out now but up until now they've caused no problems.
maybe its those that are stopping this from working
- Mark as New
- Bookmark
- Subscribe
- Mute
- Subscribe to RSS Feed
- Permalink
- Report Inappropriate Content
Very difficult to say....
- Mark as New
- Bookmark
- Subscribe
- Mute
- Subscribe to RSS Feed
- Permalink
- Report Inappropriate Content
no worries, thanks for your help, i will sort out these synthetic keys and try again.
- Mark as New
- Bookmark
- Subscribe
- Mute
- Subscribe to RSS Feed
- Permalink
- Report Inappropriate Content
i have managed to get an example where its not working.
any chance you could see if anything jumps out? !
- Mark as New
- Bookmark
- Subscribe
- Mute
- Subscribe to RSS Feed
- Permalink
- Report Inappropriate Content
Try this
=Max({<MAT_Year = {'Current Year (MAT)'}>}nd_CALENDAR_YYYYMMDD)
- « Previous Replies
-
- 1
- 2
- Next Replies »