Unlock a world of possibilities! Login now and discover the exclusive benefits awaiting you.
- Qlik Community
- :
- All Forums
- :
- QlikView App Dev
- :
- Split the billing by months based on the frequency...
- Subscribe to RSS Feed
- Mark Topic as New
- Mark Topic as Read
- Float this Topic for Current User
- Bookmark
- Subscribe
- Mute
- Printer Friendly Page
- Mark as New
- Bookmark
- Subscribe
- Mute
- Subscribe to RSS Feed
- Permalink
- Report Inappropriate Content
Split the billing by months based on the frequency level in pivot table
Hi Team,
I am working on the requirement, requirement is to plot on which month a particular policy@ is due for billing and to identify the billing Frequency of a particular policy and plot on which month the billing will fall. You will base the starting billing month on the Date value (consider month only).
Available values for Frequency are 1, 2, 4, 12
1 = only 1 billing for the whole year
2 = bi yearly billing (every 6 months)
4 = quarterly billing
12 = every month billing
Attached the source data and the required output.
Note: Logic should be implement in script level,
This is the critical issue. Can any one help me on this. Thanks.
Accepted Solutions
- Mark as New
- Bookmark
- Subscribe
- Mute
- Subscribe to RSS Feed
- Permalink
- Report Inappropriate Content
Source:
LOAD * INLINE [
Policy No, Date, Frequency
101, 4/3/2015, 12
102, 6/5/2015, 1
103, 2/3/2015, 4
104, 7/5/2015, 4
105, 4/4/2015, 2
106, 7/7/2015, 2
];
Finel:
load *,
Date(AddMonths(MonthStart(Date),(IterNo()-1)*(12/Frequency)),'MMM') as Mon
Resident Source
while IterNo()<=Frequency;
table:
load [Policy No], Date, Frequency,
date(SetDateYear(Mon,15),'MMM') as Month
Resident Finel;
Drop Table Source,Finel;
- Mark as New
- Bookmark
- Subscribe
- Mute
- Subscribe to RSS Feed
- Permalink
- Report Inappropriate Content
Try this
this will help you
Source:
LOAD * INLINE [
Policy No, Date, Frequency
101, 4/3/2015, 12
101, 6/5/2015, 1
101, 2/3/2015, 4
101, 7/5/2015, 4
101, 4/4/2015, 2
101, 7/7/2015, 2
];
Finel:
load *,
AutoNumberHash128([Policy No]&'-'&Date&'-'&Frequency) as %Key,
Date(AddMonths(MonthStart(Date),(IterNo()-1)*(12/Frequency) ),'MMM') as Month
Resident Source
while IterNo()<=Frequency;
;
Drop Table Source
- Mark as New
- Bookmark
- Subscribe
- Mute
- Subscribe to RSS Feed
- Permalink
- Report Inappropriate Content
Hi Pavan,
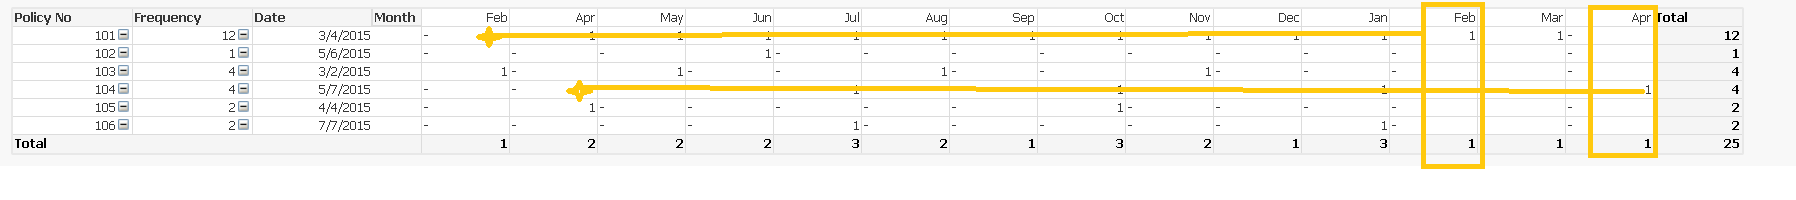
Thanks for the reply, when i have multiple policy numbers the billing frequency for months getting null and billing value (1) , So months are repeating to show the billing frequency. Only Feb & April values coming has the issue. the values has to come to arrow placed position,since the 'null' is presenting in that same place for feb & April displaying two times to represent the value '1'. Please find the issue screen below
- Mark as New
- Bookmark
- Subscribe
- Mute
- Subscribe to RSS Feed
- Permalink
- Report Inappropriate Content
Source:
LOAD * INLINE [
Policy No, Date, Frequency
101, 4/3/2015, 12
102, 6/5/2015, 1
103, 2/3/2015, 4
104, 7/5/2015, 4
105, 4/4/2015, 2
106, 7/7/2015, 2
];
Finel:
load *,
Date(AddMonths(MonthStart(Date),(IterNo()-1)*(12/Frequency)),'MMM') as Mon
Resident Source
while IterNo()<=Frequency;
table:
load [Policy No], Date, Frequency,
date(SetDateYear(Mon,15),'MMM') as Month
Resident Finel;
Drop Table Source,Finel;
- Mark as New
- Bookmark
- Subscribe
- Mute
- Subscribe to RSS Feed
- Permalink
- Report Inappropriate Content
Thanks a lot Pavan.