Unlock a world of possibilities! Login now and discover the exclusive benefits awaiting you.
- Qlik Community
- :
- All Forums
- :
- QlikView App Dev
- :
- Stacked Bar Chart with multiple Dimension
- Subscribe to RSS Feed
- Mark Topic as New
- Mark Topic as Read
- Float this Topic for Current User
- Bookmark
- Subscribe
- Mute
- Printer Friendly Page
- Mark as New
- Bookmark
- Subscribe
- Mute
- Subscribe to RSS Feed
- Permalink
- Report Inappropriate Content
Stacked Bar Chart with multiple Dimension
Hello Community,
I'm looking for your help on a problem encountered in Qlikview.
Here, the look of my database :

Each line corresponds to a fulfilled survey and in fields Q1, Q2 , ... you can see the answer of the question.
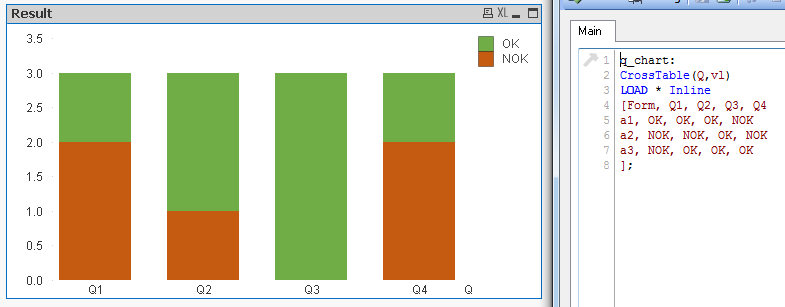
I would like to stack per question the results in a single stacked bar chart like the next image, but if I use more than one dimension it combinates it like when you are using Year and month.

Thank you for your help in advance !
- Mark as New
- Bookmark
- Subscribe
- Mute
- Subscribe to RSS Feed
- Permalink
- Report Inappropriate Content
Hello!
You can use CrossTable() conversation in your script for transforming original table:
PFA. Hope it will help you. If it so - please close the thread.
- Mark as New
- Bookmark
- Subscribe
- Mute
- Subscribe to RSS Feed
- Permalink
- Report Inappropriate Content
Thank you for sharing with me this function.
It's well working !