Unlock a world of possibilities! Login now and discover the exclusive benefits awaiting you.
- Qlik Community
- :
- All Forums
- :
- QlikView App Dev
- :
- Re: Stacked Bar chart with 2 dimensions and 2 Expr...
- Subscribe to RSS Feed
- Mark Topic as New
- Mark Topic as Read
- Float this Topic for Current User
- Bookmark
- Subscribe
- Mute
- Printer Friendly Page
- Mark as New
- Bookmark
- Subscribe
- Mute
- Subscribe to RSS Feed
- Permalink
- Report Inappropriate Content
Stacked Bar chart with 2 dimensions and 2 Expressions
Hi All,
I have created a below stacked bar chart with help of 2 dimensions and 1 expression and it is as expected. I want to add another expression in order to compare both the details side by side
1st Expression : Sum (Policy Required)
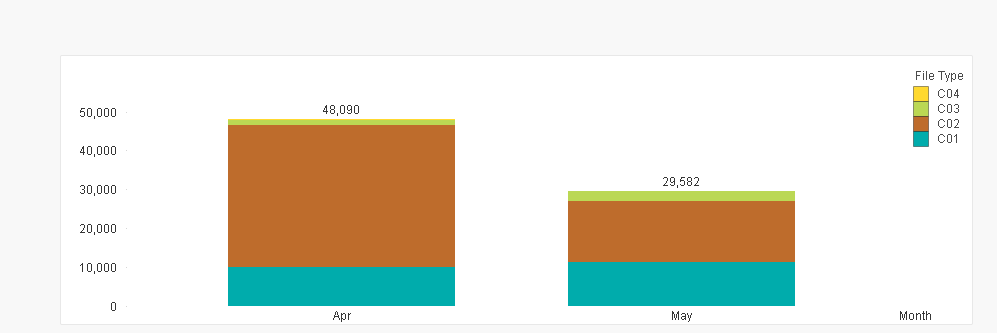
I want to add another expression in order to compare both the details side by side
2nd Expression : Sum(Policy Collected)
When I am adding the 2nd expression chart is getting changed as below.
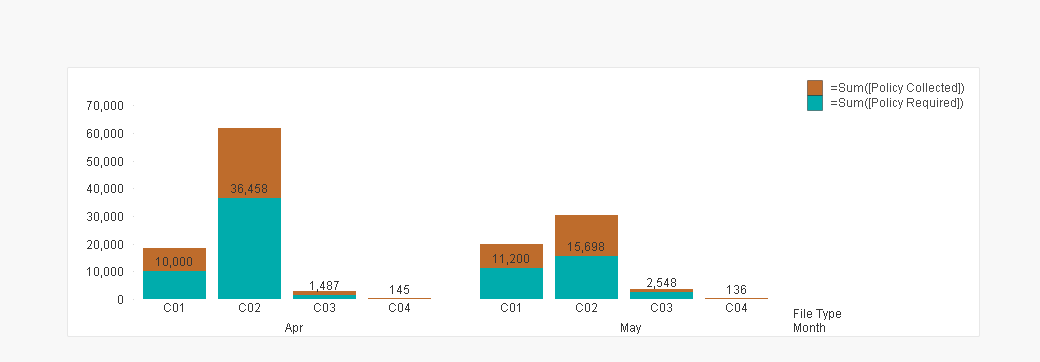
How do I create two bars with 2 expressions and internally it should get divided with file type based on month.
Attached is the sample qvw and data.
Accepted Solutions
- Mark as New
- Bookmark
- Subscribe
- Mute
- Subscribe to RSS Feed
- Permalink
- Report Inappropriate Content
- Mark as New
- Bookmark
- Subscribe
- Mute
- Subscribe to RSS Feed
- Permalink
- Report Inappropriate Content
Hi Gayatri,
Is this what you're looking for?:
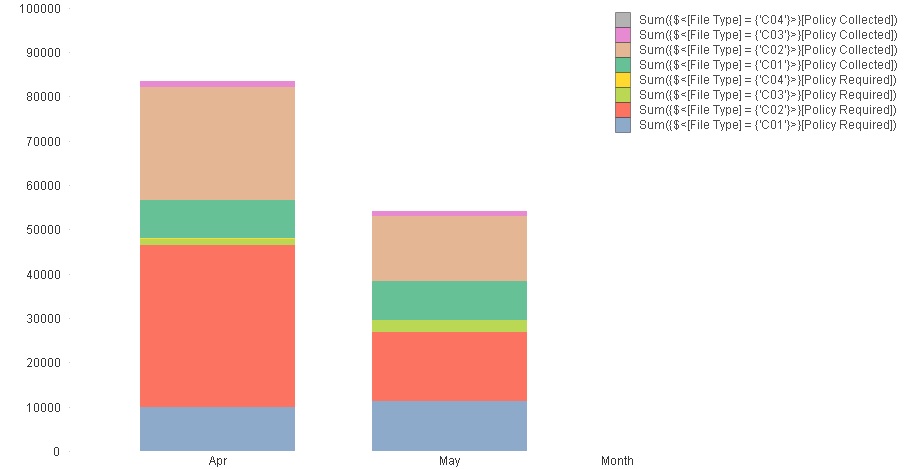
One dimension: Month
Eight expressions:
Sum({$<[File Type] = {'C01'}>}[Policy Required])
Sum({$<[File Type] = {'C02'}>}[Policy Required])
Sum({$<[File Type] = {'C03'}>}[Policy Required])
Sum({$<[File Type] = {'C04'}>}[Policy Required])
Sum({$<[File Type] = {'C01'}>}[Policy Collected])
Sum({$<[File Type] = {'C02'}>}[Policy Collected])
Sum({$<[File Type] = {'C03'}>}[Policy Collected])
Sum({$<[File Type] = {'C04'}>}[Policy Collected])
- Mark as New
- Bookmark
- Subscribe
- Mute
- Subscribe to RSS Feed
- Permalink
- Report Inappropriate Content
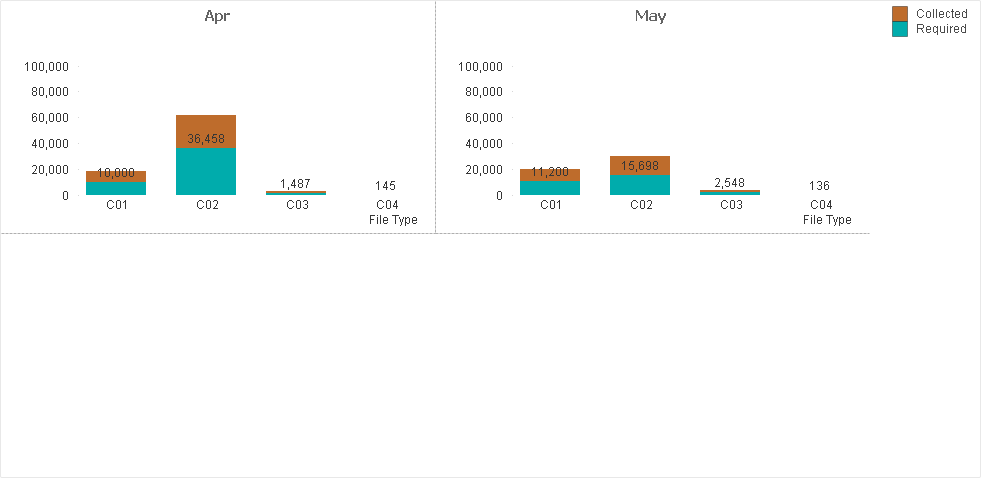
Trellis can be used for your requirement
- Mark as New
- Bookmark
- Subscribe
- Mute
- Subscribe to RSS Feed
- Permalink
- Report Inappropriate Content
Hi Andrew,
Thanks for your time. But I have tried that using C01, C02 etc in expression directly. But it is not fulfilling my requirement as I want to compare the Sum of Policy Required and Policy Collected based on month and File type.
In the above chart it is bit difficult to compare the both. I want something like below. two different bars for expression
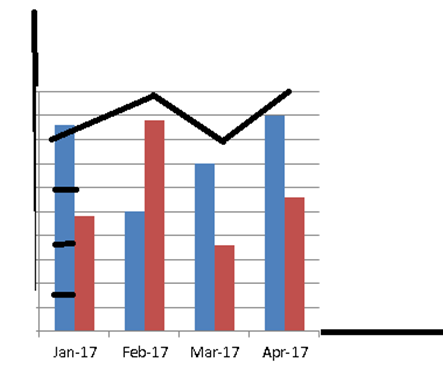
and that bar should get divided into file type.
- Mark as New
- Bookmark
- Subscribe
- Mute
- Subscribe to RSS Feed
- Permalink
- Report Inappropriate Content
Thanks for your time Susant. I will try that option. But I want my chart to look like below.

- Mark as New
- Bookmark
- Subscribe
- Mute
- Subscribe to RSS Feed
- Permalink
- Report Inappropriate Content
See Attachment.

- Mark as New
- Bookmark
- Subscribe
- Mute
- Subscribe to RSS Feed
- Permalink
- Report Inappropriate Content
Hi Gayatri,
What about:
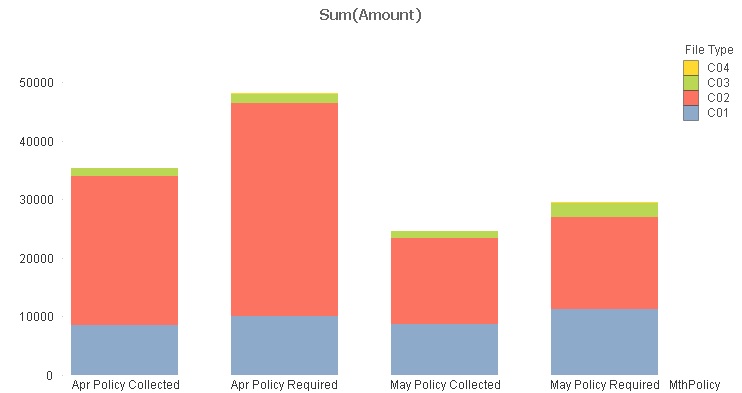
Data:
CrossTable (Policy, Amount, 2)
LOAD Month,
[File Type],
[Policy Required],
[Policy Collected]
FROM
[Sample Data.xlsx]
(ooxml, embedded labels, table is Sheet1);
Left Join
LOAD
Distinct
Month & ' ' & Policy as MthPolicy,
* Resident Data;
Chart dimensions are MthPolicy and [File Type]
Cheers
Andrew
- Mark as New
- Bookmark
- Subscribe
- Mute
- Subscribe to RSS Feed
- Permalink
- Report Inappropriate Content
It looks exactly what I want. Let me try this. Thanks
- Mark as New
- Bookmark
- Subscribe
- Mute
- Subscribe to RSS Feed
- Permalink
- Report Inappropriate Content
Hi Antonia,
Thanks for the reply. Its perfect..