Unlock a world of possibilities! Login now and discover the exclusive benefits awaiting you.
- Qlik Community
- :
- All Forums
- :
- QlikView App Dev
- :
- Stacked Bar chart
- Subscribe to RSS Feed
- Mark Topic as New
- Mark Topic as Read
- Float this Topic for Current User
- Bookmark
- Subscribe
- Mute
- Printer Friendly Page
- Mark as New
- Bookmark
- Subscribe
- Mute
- Subscribe to RSS Feed
- Permalink
- Report Inappropriate Content
Stacked Bar chart
Guys,
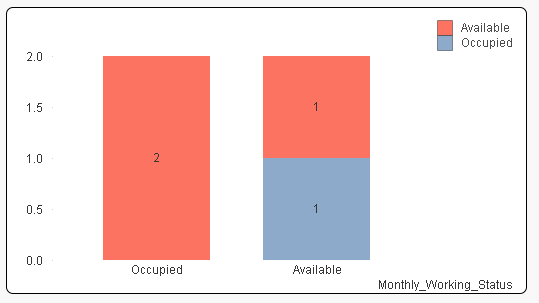
when I give two expressions and style as stacked in bar chart, I want to get two separate bars displayed in the bar chart. But I couldn't get this. Please help and I have attached the screenshots below,
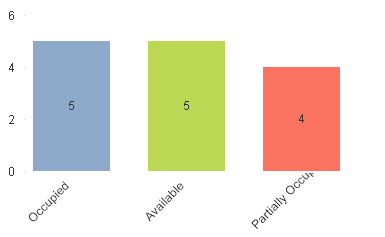
I'm getting the chart like this, but I need the separate charts like below,

The expressions I used are
=count(DISTINCT Aggr(if(round(sum(WorkHours1)/Count(DISTINCT MonthName))>=8,EmployeeID),EmployeeID)) and
=count( Aggr(if(round(sum(WorkHours1)/Count(DISTINCT MonthName))<4 ,EmployeeID),EmployeeID))
- Mark as New
- Bookmark
- Subscribe
- Mute
- Subscribe to RSS Feed
- Permalink
- Report Inappropriate Content
What works with Stacked Charts
single dimension and two expression
2 Dimension single Expression
What won't work
Multiple dimension and Multiple Expressions
can you share a sample app?
If a post helps to resolve your issue, please accept it as a Solution.