Unlock a world of possibilities! Login now and discover the exclusive benefits awaiting you.
- Qlik Community
- :
- All Forums
- :
- QlikView App Dev
- :
- Re: Stacked bar chart - Values on data point for b...
- Subscribe to RSS Feed
- Mark Topic as New
- Mark Topic as Read
- Float this Topic for Current User
- Bookmark
- Subscribe
- Mute
- Printer Friendly Page
- Mark as New
- Bookmark
- Subscribe
- Mute
- Subscribe to RSS Feed
- Permalink
- Report Inappropriate Content
Stacked bar chart - Values on data point for both the product
hi all
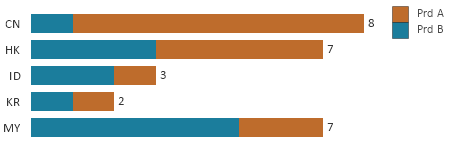
i have a stacked bar chart for Prd A and Prd B. i would like to show both the breakups sepearetly. eg for CN- Prd A the brown color part should show 6 and Prd B the blue color part should show 2. any idea. thnals
Accepted Solutions
- Mark as New
- Bookmark
- Subscribe
- Mute
- Subscribe to RSS Feed
- Permalink
- Report Inappropriate Content
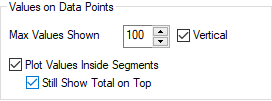
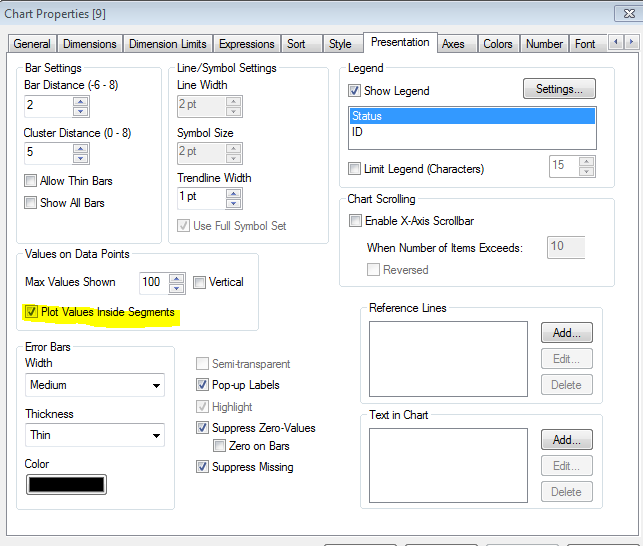
If you are using QV12 or QV11.2 SR12+ the additional option "Still Show Total on Top" is available in the Presentation tab. This provides for displaying values in the segments and a total on top of the bar.
Bar Chart Viz Tidbits in Version 12 | Qlikview Cookbook
-Rob
- Mark as New
- Bookmark
- Subscribe
- Mute
- Subscribe to RSS Feed
- Permalink
- Report Inappropriate Content
Try to check Plot values inside the segments from Presentation tab of the chart properties.
- Mark as New
- Bookmark
- Subscribe
- Mute
- Subscribe to RSS Feed
- Permalink
- Report Inappropriate Content
hi vizhwarath,
thanks for the help but if i do that my total will go off i need both total value and seperate value.
thanks
- Mark as New
- Bookmark
- Subscribe
- Mute
- Subscribe to RSS Feed
- Permalink
- Report Inappropriate Content
If you are using QV12 or QV11.2 SR12+ the additional option "Still Show Total on Top" is available in the Presentation tab. This provides for displaying values in the segments and a total on top of the bar.
Bar Chart Viz Tidbits in Version 12 | Qlikview Cookbook
-Rob