Unlock a world of possibilities! Login now and discover the exclusive benefits awaiting you.
- Qlik Community
- :
- All Forums
- :
- QlikView App Dev
- :
- Re: Status Box!
- Subscribe to RSS Feed
- Mark Topic as New
- Mark Topic as Read
- Float this Topic for Current User
- Bookmark
- Subscribe
- Mute
- Printer Friendly Page
- Mark as New
- Bookmark
- Subscribe
- Mute
- Subscribe to RSS Feed
- Permalink
- Report Inappropriate Content
Status Box!
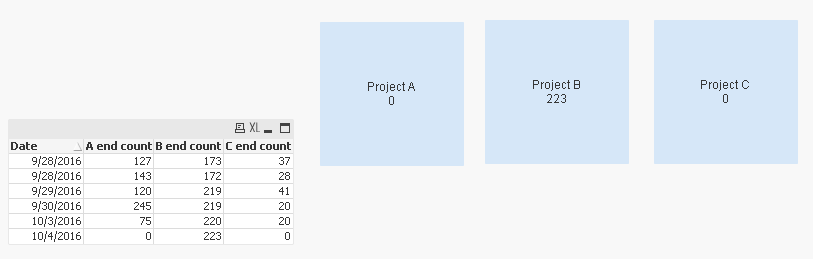
| Date | A end count | B end count | C end count |
| 9/28/2016 | 143 | 172 | 28 |
| 9/28/2016 | 127 | 173 | 37 |
| 9/29/2016 | 120 | 219 | 41 |
| 9/30/2016 | 245 | 219 | 20 |
| 10/3/2016 | 75 | 220 | 20 |
| 10/4/2016 | 0 | 223 | 0 |
Hi!!
this is the same data for my question.this is a task tracker. and work comes into my tasktracker as i am working. so I just log the number of tasks that I have on my queue at the end of the day. so that the next day, i can start with something that has most volume in the task tracker.
what i want to do is make a small box that contains the most recently logged end count for the three jobs.
so today is 5th Oct and I did not log any anything. but the most recent task tracker log says that i have 0 task for project A 223 tasks for project B 0 tasks for project C
I want them to float in a box with caption name project A and contents with larger sized numbers.
Please help!!
Thank you in advance!! 
- « Previous Replies
-
- 1
- 2
- Next Replies »
- Mark as New
- Bookmark
- Subscribe
- Mute
- Subscribe to RSS Feed
- Permalink
- Report Inappropriate Content
Updated sample
- Mark as New
- Bookmark
- Subscribe
- Mute
- Subscribe to RSS Feed
- Permalink
- Report Inappropriate Content
Hi Sunny, there are multiple tables in my dashboard and each have different Date name.
for this, it is Project.Date
='Project A' & Chr(10) & Sum({<Project.Date= {"$(=Date(Max(Project.Date), 'M/D/YYYY'))"}>} [A end count])
do you think this is correct? I am trying out few things, not working yet.
and can I remove Chr()?? what does it do??
- Mark as New
- Bookmark
- Subscribe
- Mute
- Subscribe to RSS Feed
- Permalink
- Report Inappropriate Content
Expression looks good to me. Chr(10) just pushes the number to the next row
- Mark as New
- Bookmark
- Subscribe
- Mute
- Subscribe to RSS Feed
- Permalink
- Report Inappropriate Content
It is working!!! thank you so much Sunny!!!!!
- « Previous Replies
-
- 1
- 2
- Next Replies »