Unlock a world of possibilities! Login now and discover the exclusive benefits awaiting you.
- Qlik Community
- :
- All Forums
- :
- QlikView App Dev
- :
- Re: Straight Table Total percentage is not right
- Subscribe to RSS Feed
- Mark Topic as New
- Mark Topic as Read
- Float this Topic for Current User
- Bookmark
- Subscribe
- Mute
- Printer Friendly Page
- Mark as New
- Bookmark
- Subscribe
- Mute
- Subscribe to RSS Feed
- Permalink
- Report Inappropriate Content
Straight Table Total percentage is not right
Hello all,
I have a problem need you help. I have a straight table like the sample. you can check the attach.
The question is the 'Rate' Total of the bottom is not right or null when click button.
when click '<>0' the Total is right.
when click '>0<=26' or '>26<=100' the Total is null.
when click '>100' the Total is not the filter data percentage total, but the all data percentage total.
I need the Rate column show the result is [Sales6]/[Sales5]*100% when I click any button or filter.
thanks,
Kevin.
- Tags:
- chart
- expression
Accepted Solutions
- Mark as New
- Bookmark
- Subscribe
- Mute
- Subscribe to RSS Feed
- Permalink
- Report Inappropriate Content
Hi Kevin,
I have used the set analysis to implement your requirements, check out the attachements
- Mark as New
- Bookmark
- Subscribe
- Mute
- Subscribe to RSS Feed
- Permalink
- Report Inappropriate Content
Hi Kevin,
Please check the app attached, i have changed the rate total to show avg as this is %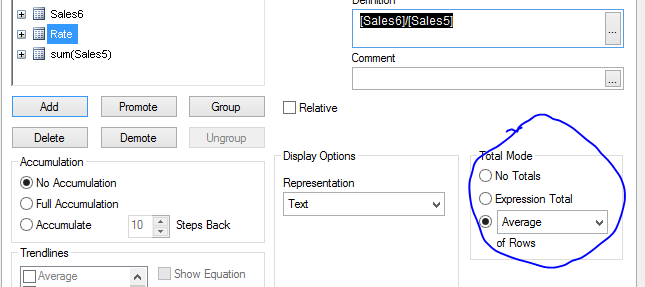
- Mark as New
- Bookmark
- Subscribe
- Mute
- Subscribe to RSS Feed
- Permalink
- Report Inappropriate Content
Hi Shingote,
Thanks for your suggestion, if set the Total as Avg , the Total just the Column's avg, is not Total [Sales6]/[Sales5].
Avg Rate is 82.9%=(90%+84.6%+80.0%+76.9%)/4,
but actually it should be (311/396)*100% =78.5%.
thanks,
Kevin.
- Mark as New
- Bookmark
- Subscribe
- Mute
- Subscribe to RSS Feed
- Permalink
- Report Inappropriate Content
Hi Kevin,
I have used the set analysis to implement your requirements, check out the attachements
- Mark as New
- Bookmark
- Subscribe
- Mute
- Subscribe to RSS Feed
- Permalink
- Report Inappropriate Content
Thank you so much Shingote,
your answer is a great help for me,it's very grateful!
just one more question about this,
because my new requirement need add a another field Sales7, and this filed not in the same row with other data.
but still need compare with Sales5. so when I use the set analysis like Saes6, it will make the Sales7 no change when click button.
so the problem is when use the Sales7, when click button the Rate Total is still null or not right except button click "<>0".
pls check the sample.
it's very