Unlock a world of possibilities! Login now and discover the exclusive benefits awaiting you.
- Qlik Community
- :
- All Forums
- :
- QlikView App Dev
- :
- Re: Strange Barchart layout when limit the second ...
- Subscribe to RSS Feed
- Mark Topic as New
- Mark Topic as Read
- Float this Topic for Current User
- Bookmark
- Subscribe
- Mute
- Printer Friendly Page
- Mark as New
- Bookmark
- Subscribe
- Mute
- Subscribe to RSS Feed
- Permalink
- Report Inappropriate Content
Strange Barchart layout when limit the second dimension
Hi all,
I found that when my barchart has 2 dimensions, the layout shows wrong and I don't know why.
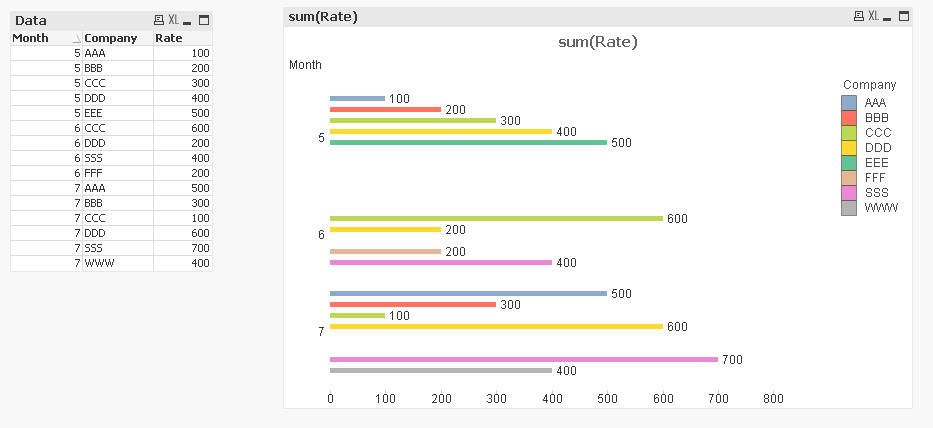
You can see my example data and the barchart, there are some strange space in the barchart.
And I want to get the top 3 per month, I can done the function, but the layout is strange.
Do you know why and any method to solve that?
Thanks.
Aiolos Zhao
- « Previous Replies
-
- 1
- 2
- Next Replies »
Accepted Solutions
- Mark as New
- Bookmark
- Subscribe
- Mute
- Subscribe to RSS Feed
- Permalink
- Report Inappropriate Content
Another solution could be like, create composite dimension of Month & Company. Use color with Fieldindex function to give color to each company. And use straight table as customized legend.

- Mark as New
- Bookmark
- Subscribe
- Mute
- Subscribe to RSS Feed
- Permalink
- Report Inappropriate Content
Are the gaps not just where you don't have any values for your dimensions? e.g. you have no values for month 5 for Companies SSS, FFF and WWW.
Andy
- Mark as New
- Bookmark
- Subscribe
- Mute
- Subscribe to RSS Feed
- Permalink
- Report Inappropriate Content
thanks for reply, and are you sure with that? it looks like a bug in qlikview I think, or do you have any method to solve that?
- Mark as New
- Bookmark
- Subscribe
- Mute
- Subscribe to RSS Feed
- Permalink
- Report Inappropriate Content
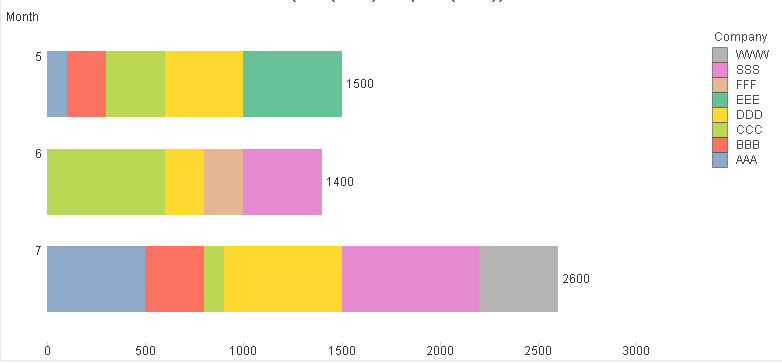
I don't think so whether we can suspect those null value when we have 2 dimensions? the moment you are talking is and DV is good. But, one free idea - How about Subtype (Stacked) rather Grouped.
- Mark as New
- Bookmark
- Subscribe
- Mute
- Subscribe to RSS Feed
- Permalink
- Report Inappropriate Content
what's DV?
Actually I tried the Stacked, it's fine. but I want grouped...because I want to show the comparison among these values.
so...any ideas? I have suppress the null value in dimension, but it's useless.
- Mark as New
- Bookmark
- Subscribe
- Mute
- Subscribe to RSS Feed
- Permalink
- Report Inappropriate Content
Data Visualization.
And i refer this !!! If comparison then Grouped may good rather Stacked
- Mark as New
- Bookmark
- Subscribe
- Mute
- Subscribe to RSS Feed
- Permalink
- Report Inappropriate Content
Yes, I have tried this, but grouped has problem like I said... so I don't know what to do now...
I want to use grouped but...
- Mark as New
- Bookmark
- Subscribe
- Mute
- Subscribe to RSS Feed
- Permalink
- Report Inappropriate Content
These gaps are due to Company vales are missing from some of the months, for eg. In month 5 you have 5 Company while in month 6 You have just 2. So that Space is there due to missing Company value
- Mark as New
- Bookmark
- Subscribe
- Mute
- Subscribe to RSS Feed
- Permalink
- Report Inappropriate Content
Hi again,
would you really have months were companies have 'null' sales if you were using 'real' data? If not, then you wouldn't have the issue..
Andy
- Mark as New
- Bookmark
- Subscribe
- Mute
- Subscribe to RSS Feed
- Permalink
- Report Inappropriate Content
thanks for reply, but even I tried the check the suppress missing in presentation tab, it doesn't work, I think it's like a bug, because it's really stupid if the chart keep the space even I don't have the value.
So do you have any ideas to solve or replace that?
Thanks
Aiolos
- « Previous Replies
-
- 1
- 2
- Next Replies »