Unlock a world of possibilities! Login now and discover the exclusive benefits awaiting you.
- Qlik Community
- :
- All Forums
- :
- QlikView App Dev
- :
- Strange Sum-result in Qlikview
- Subscribe to RSS Feed
- Mark Topic as New
- Mark Topic as Read
- Float this Topic for Current User
- Bookmark
- Subscribe
- Mute
- Printer Friendly Page
- Mark as New
- Bookmark
- Subscribe
- Mute
- Subscribe to RSS Feed
- Permalink
- Report Inappropriate Content
Strange Sum-result in Qlikview
Dear Qlikviewers,
I am encountering a issue where I don't understand why Qlikview applies the logic that it does.
Let me explain below.
I have a database with two tables (simplified example below):
| Data | BusinessDay |
|---|---|
| Shipmentdate | Shipmentdate |
| Shipments | MTD_BusinessDay |
After loading, I make a straight table, which ends up like this:
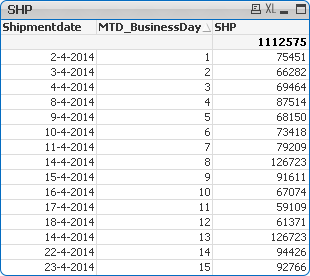
We see the Shipmentdate from both tables as the key, the MTD_BusinessDay from the right table and the SHP from the left.
So far, so good. However, when you manually add up the figures, you come to 1.239.298 instead of the 1.112.575 Qlikview shows.
I have found out what happens: in the table, you can see that MTD_BusinessDay 8 and 13 both have 14-4-2014 as Shipmentdate.
This is intentional, so this is exactly like it's supposed to be. However, Qlikview now only adds ONE of the two in the SHP-total.
The formula used for the SHP is:
=sum({$<Shipmentdate={'<=$(=vYesterdayLastYear)'},MTD_BusinessDay={'<>0'}>} SHP)
where vYesterdayLastYear = 23-4-2014.
My question now is: why does Qlikview only add the SHP once when calculating the total?
And: is there a way to force Qlikview to make the right sum?
Thanks in advance!
KR,
Stefan
Accepted Solutions
- Mark as New
- Bookmark
- Subscribe
- Mute
- Subscribe to RSS Feed
- Permalink
- Report Inappropriate Content
Hi,
Use AGGR()
try below
Sum(AGGR(sum({$<Shipmentdate={'<=$(=vYesterdayLastYear)'},MTD_BusinessDay={'<>0'}>} SHP),shipmentdate,MTD_BussinessDay))
In Aggr() write your dimension of chart.
Regards
Please appreciate our Qlik community members by giving Kudos for sharing their time for your query. If your query is answered, please mark the topic as resolved 🙂
- Mark as New
- Bookmark
- Subscribe
- Mute
- Subscribe to RSS Feed
- Permalink
- Report Inappropriate Content
Like a charm! Can't believe I have been searching for 30 minutes and didn't think of this... Thansk a lot Max!
- Mark as New
- Bookmark
- Subscribe
- Mute
- Subscribe to RSS Feed
- Permalink
- Report Inappropriate Content

You Welcome
Please appreciate our Qlik community members by giving Kudos for sharing their time for your query. If your query is answered, please mark the topic as resolved 🙂