Unlock a world of possibilities! Login now and discover the exclusive benefits awaiting you.
- Qlik Community
- :
- All Forums
- :
- QlikView App Dev
- :
- Re: Sum Credit/Debit if matching condition met
- Subscribe to RSS Feed
- Mark Topic as New
- Mark Topic as Read
- Float this Topic for Current User
- Bookmark
- Subscribe
- Mute
- Printer Friendly Page
- Mark as New
- Bookmark
- Subscribe
- Mute
- Subscribe to RSS Feed
- Permalink
- Report Inappropriate Content
Sum Credit/Debit if matching condition met
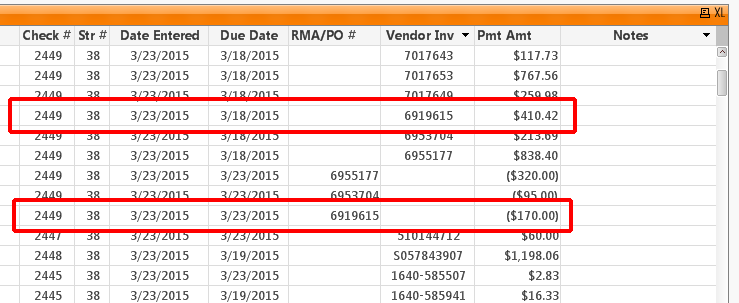
In this chart, I need to combine (calculate) for a net total if the number in the RMA/PO# column and the Vendor Inv column match. This is an accounts payable function. So on the same check number there in an invoice and a debit and I want to combine these two lines for a Pmt Amt that would equal $240.42 as the information from this chart is exported into the accounting software. This would eliminate repetitive tasks for the employee.
How would I write an expression that would do this?
Message was edited by: Jennie Elliott I have added an example of what my end results should be Attached is what I am trying to achieve: If RMA/PO# = Vendor Inv, then Sum for a Net Payment (Invoice - Credit). I need to combine these matching lines into one line if those numbers match. Do I script this or write an expression?
- Tags:
- qlikview_scripting
- « Previous Replies
-
- 1
- 2
- Next Replies »
- Mark as New
- Bookmark
- Subscribe
- Mute
- Subscribe to RSS Feed
- Permalink
- Report Inappropriate Content
Hi - I loaded a new 'ID' field that takes its value from the RMA/PO # or the Vendor Inv field depending which is null().
Data:
LOAD Check,
Date,
RMA,
[Vendor Inv],
if( isnull(RMA),[Vendor Inv],RMA) as ID,
E
FROM
(ooxml, embedded labels, table is Sheet1);
ID:
Load
Distinct
ID
resident Data;
Then i created a straight table with ID as a dimension (but hidden per presentation tab settings).
It gave me this for attached data sample.
Does this help ?
- Mark as New
- Bookmark
- Subscribe
- Mute
- Subscribe to RSS Feed
- Permalink
- Report Inappropriate Content
I'll try that and let you know.
Thanks!
- Mark as New
- Bookmark
- Subscribe
- Mute
- Subscribe to RSS Feed
- Permalink
- Report Inappropriate Content
Here is a variant using a calculated dimension (could be done in the load script thus removing the need for a calculated dimension), a pivot table, and partial sum on the [Date Entered] field. The expression is simply
Sum([Pmt Amt]). Have attached a sample app too.
The first table is just a Table Box to illustrate the raw table. The second table is a pivot with all dimensions expanded. The third table is just a copy of the second to show how it looks like when you "Collapse All" on the first dimension giving you hopefully exactly what you want your users to export to Excel...
- Mark as New
- Bookmark
- Subscribe
- Mute
- Subscribe to RSS Feed
- Permalink
- Report Inappropriate Content
I cant' put it in a Pivot Table due to having to export all data into Great Plains accounting software. It must be in a straight table chart.
- Mark as New
- Bookmark
- Subscribe
- Mute
- Subscribe to RSS Feed
- Permalink
- Report Inappropriate Content
Neither Export or pressing the XL icon on the title bar on the chart should work fine for Pivot Table... Can you explain in more detail?
- Mark as New
- Bookmark
- Subscribe
- Mute
- Subscribe to RSS Feed
- Permalink
- Report Inappropriate Content
I mean "Both ... and ...." not Neither ....
- Mark as New
- Bookmark
- Subscribe
- Mute
- Subscribe to RSS Feed
- Permalink
- Report Inappropriate Content
You can even automate the export from a button and calling a very simple Macro (which will run perfectly well
even on a QlikView server).
- Mark as New
- Bookmark
- Subscribe
- Mute
- Subscribe to RSS Feed
- Permalink
- Report Inappropriate Content
Or if you prefer to do it in a load script so you actually get two new fields you can even do the Export via an Action/External/Export which demands to have fields with values to be able to export - I have also attached the lates QVW with the code/app:
- Mark as New
- Bookmark
- Subscribe
- Mute
- Subscribe to RSS Feed
- Permalink
- Report Inappropriate Content
This might work better, I will try it out!
Thanks!
- « Previous Replies
-
- 1
- 2
- Next Replies »