Unlock a world of possibilities! Login now and discover the exclusive benefits awaiting you.
- Qlik Community
- :
- All Forums
- :
- QlikView App Dev
- :
- Re: Sum in pivot table? or what?...
- Subscribe to RSS Feed
- Mark Topic as New
- Mark Topic as Read
- Float this Topic for Current User
- Bookmark
- Subscribe
- Mute
- Printer Friendly Page
- Mark as New
- Bookmark
- Subscribe
- Mute
- Subscribe to RSS Feed
- Permalink
- Report Inappropriate Content
Sum in pivot table? or what?...
Hi all.
Here is my problem:
I have the following 2 tables:
1)
ID Join Date Left Date Membership Days (a variable containing the difference between date2 and date1)
111 date11 date21 1000
222 date12 date22 2000
333 date13 date23 1500
2)
ID Start Vacation Date End Vacation Date Vacation Days
111 date111 date211 400
111 date112 date212 50
222 date211 date212 200
333 date311 date312 300
I need to create the following 2 tables:
3)
ID Total Vacation Days
111 450
222 200
333 300
4)
ID Total Active Days
111 550 (=1000-450)
222 1800
333 1200
I tried using variables, pivot tables, sums etc... but couldn't get the result that I needed 😞
Thanks a lot for your help!
Merav.
Accepted Solutions
- Mark as New
- Bookmark
- Subscribe
- Mute
- Subscribe to RSS Feed
- Permalink
- Report Inappropriate Content
Hi,
I suppose it is simple equations load two tables and then have common fields ID and then leave the table as association and load it like
LOAD * INLINE [
ID, Join Date, Left Date, Membership Days
111, date11, date21, 1000
222, date12, date22, 2000
333, date13, date23, 1500
];
LOAD * INLINE [
ID, Start Vacation Date, End Vacation Date, Vacation Days
111, date111, date211, 400
111, date112, date212, 50
222, date211, date212, 200
333, date311, date312, 300
];
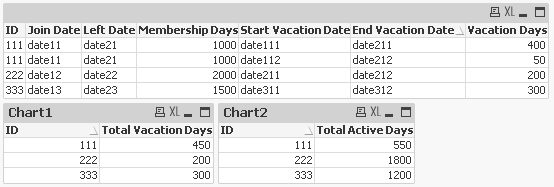
An then create the straight table or Pivot table
Chart1
Dim:- ID
Exper:- sum([Vacation Days])
Chart2
Dim:-ID
Exper:- Sum( [Membership Days] ) - sum( [Vacation Days] )
And you get the data and charts as
Regards
Anand
- Mark as New
- Bookmark
- Subscribe
- Mute
- Subscribe to RSS Feed
- Permalink
- Report Inappropriate Content
Hi,
I suppose it is simple equations load two tables and then have common fields ID and then leave the table as association and load it like
LOAD * INLINE [
ID, Join Date, Left Date, Membership Days
111, date11, date21, 1000
222, date12, date22, 2000
333, date13, date23, 1500
];
LOAD * INLINE [
ID, Start Vacation Date, End Vacation Date, Vacation Days
111, date111, date211, 400
111, date112, date212, 50
222, date211, date212, 200
333, date311, date312, 300
];
An then create the straight table or Pivot table
Chart1
Dim:- ID
Exper:- sum([Vacation Days])
Chart2
Dim:-ID
Exper:- Sum( [Membership Days] ) - sum( [Vacation Days] )
And you get the data and charts as
Regards
Anand
- Mark as New
- Bookmark
- Subscribe
- Mute
- Subscribe to RSS Feed
- Permalink
- Report Inappropriate Content
above explination is perfect
- Mark as New
- Bookmark
- Subscribe
- Mute
- Subscribe to RSS Feed
- Permalink
- Report Inappropriate Content
Oh, I feel so stupid... 🙂
Thanks a lot for your detailed help and patience in explaining.