Unlock a world of possibilities! Login now and discover the exclusive benefits awaiting you.
- Qlik Community
- :
- All Forums
- :
- QlikView App Dev
- :
- Sum of average value in Pivot chart
- Subscribe to RSS Feed
- Mark Topic as New
- Mark Topic as Read
- Float this Topic for Current User
- Bookmark
- Subscribe
- Mute
- Printer Friendly Page
- Mark as New
- Bookmark
- Subscribe
- Mute
- Subscribe to RSS Feed
- Permalink
- Report Inappropriate Content
Sum of average value in Pivot chart
Hi All,
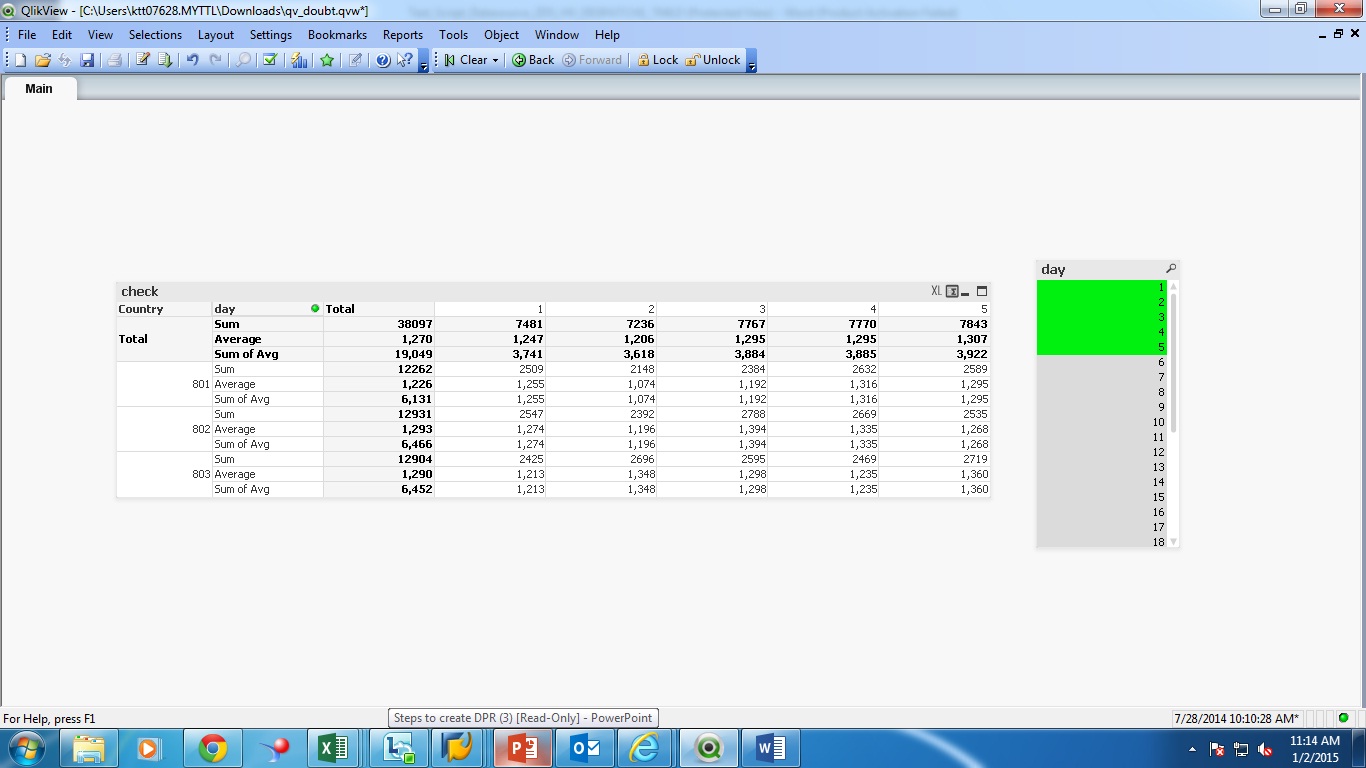
In pivot table I need to find the total sum of average for all tables. But I got wrong value for total sum of average for each day.
Please see the attachment. Can anyone help me on this.
Thank you in advance.
Kind Regards,
Tamil
- « Previous Replies
- Next Replies »
Accepted Solutions
- Mark as New
- Bookmark
- Subscribe
- Mute
- Subscribe to RSS Feed
- Permalink
- Report Inappropriate Content
Solution: 🙂
IF (ColumnNo()=0, RangeSum(top(avg( Sales),1,NoOfRows())),
IF (Dimensionality()=0,
RangeAvg(top(avg(Sales),1,NoOfRows())) ,
avg(Sales)
))

- Mark as New
- Bookmark
- Subscribe
- Mute
- Subscribe to RSS Feed
- Permalink
- Report Inappropriate Content
Trying this expression:
If(SecondaryDimensionality() = 0, Sum(Aggr(Avg(Sales), Country)), Avg(Sales))
- Mark as New
- Bookmark
- Subscribe
- Mute
- Subscribe to RSS Feed
- Permalink
- Report Inappropriate Content
Hi Tresesco,
Thank you for the reply. I have tried and still getting the same result.
- Mark as New
- Bookmark
- Subscribe
- Mute
- Subscribe to RSS Feed
- Permalink
- Report Inappropriate Content
Hi,
Try this expression
Sum(Aggr(Avg(Sales), Country, day))
Regards,
Jagan.
- Mark as New
- Bookmark
- Subscribe
- Mute
- Subscribe to RSS Feed
- Permalink
- Report Inappropriate Content
Hi Tamil
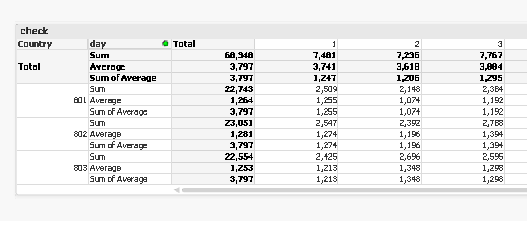
i have tried, please check the screenshot below:

- Mark as New
- Bookmark
- Subscribe
- Mute
- Subscribe to RSS Feed
- Permalink
- Report Inappropriate Content
Hi Jagan,
Thanks working fine and I will mark it as correct answer.![]() . I have one more request. Is it possible to get total sum of all average values instead of average of all average values like below screenshot.?
. I have one more request. Is it possible to get total sum of all average values instead of average of all average values like below screenshot.?
- Mark as New
- Bookmark
- Subscribe
- Mute
- Subscribe to RSS Feed
- Permalink
- Report Inappropriate Content
Hi Kushal,
Yes. Its working. Thank you for checking.![]()
- Mark as New
- Bookmark
- Subscribe
- Mute
- Subscribe to RSS Feed
- Permalink
- Report Inappropriate Content
Hi,
What is your expected value?
Regards,
Jagan.
- Mark as New
- Bookmark
- Subscribe
- Mute
- Subscribe to RSS Feed
- Permalink
- Report Inappropriate Content
It should be displayed as 3798 in total. I have attached screenshot above.
- Mark as New
- Bookmark
- Subscribe
- Mute
- Subscribe to RSS Feed
- Permalink
- Report Inappropriate Content
Just for the Records, this one also works and place the - in the upper rows.
IF (Dimensionality()=0, RangeSum(top(avg(Sales),1,NoOfRows())))
- « Previous Replies
- Next Replies »