Unlock a world of possibilities! Login now and discover the exclusive benefits awaiting you.
- Qlik Community
- :
- All Forums
- :
- QlikView App Dev
- :
- Re: Suppress zero values in pie chart
- Subscribe to RSS Feed
- Mark Topic as New
- Mark Topic as Read
- Float this Topic for Current User
- Bookmark
- Subscribe
- Mute
- Printer Friendly Page
- Mark as New
- Bookmark
- Subscribe
- Mute
- Subscribe to RSS Feed
- Permalink
- Report Inappropriate Content
Suppress zero values in pie chart
Hello,
I have a data set imported from an SQL Table like:
| Subject | Invoice No. | 1-30 | 31-60 | 61-90 | Total Amount |
|---|---|---|---|---|---|
| Subject 1 | Inv001 | 100 | 0 | 0 | 100 |
| Subject 1 | Inv002 | 0 | 200 | 0 | 200 |
| Subject 2 | Inv003 | 0 | 0 | 100 | 100 |
| Subject 2 | Inv004 | 0 | 50 | 0 | 50 |
I want to create a pie chart to show me each column summary share in the total amount for the columns 1-30, 31-60, 61-90. I don't have any dimension in the pie chart, I only have expressions for each share that I need:
SUM([1-30])/SUM(Amount)
SUM([31-60])/SUM(Amount)
SUM([61-90])/SUM(Amount)
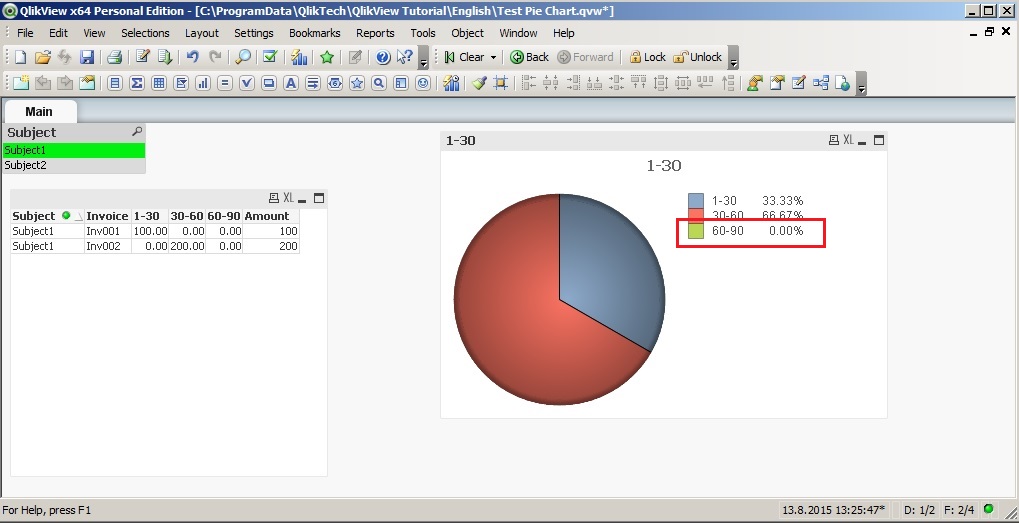
The problem that I get is that the pie chart always shows zero values although it's marked suppress zero values in the presentation tab
Does anyone have a solution for this?
Thank you...
Djordje
- Mark as New
- Bookmark
- Subscribe
- Mute
- Subscribe to RSS Feed
- Permalink
- Report Inappropriate Content
try this
SUM([1-30])/SUM({<Amount= {">0"}>}Amount)
SUM([31-60])/SUM({<Amount= {">0"}>}Amount)
SUM([61-90])/SUM({<Amount= {">0"}>}Amount)
- Mark as New
- Bookmark
- Subscribe
- Mute
- Subscribe to RSS Feed
- Permalink
- Report Inappropriate Content
It doesn't work, I mean, I get the same result with this.
- Mark as New
- Bookmark
- Subscribe
- Mute
- Subscribe to RSS Feed
- Permalink
- Report Inappropriate Content
Djordje,
We can fix this by using expression conditions. check the attached qvw.
hope this solves your pie chart issue.
thanks
Brad.