Unlock a world of possibilities! Login now and discover the exclusive benefits awaiting you.
- Qlik Community
- :
- All Forums
- :
- QlikView App Dev
- :
- Re: To Use AGGR or TOTAL
- Subscribe to RSS Feed
- Mark Topic as New
- Mark Topic as Read
- Float this Topic for Current User
- Bookmark
- Subscribe
- Mute
- Printer Friendly Page
- Mark as New
- Bookmark
- Subscribe
- Mute
- Subscribe to RSS Feed
- Permalink
- Report Inappropriate Content
To Use AGGR or TOTAL
Hi
I have a set of data as below.
| Sales No. | Salesperson | Product name | $ | Multiplier | $ aft multiplier |
| 3505 | aa | hearts | 3,570 | 1 | 3,570 |
| 7417 | aa | spade | 16,784 | 2.5 | 41,960 |
| 8279 | aa | spade | 3,602 | 2.5 | 9,004 |
| 9794 | aa | hearts | 3,397 | 1 | 3,397 |
| 6541 | bb | spade | 3,005 | 2.5 | 7,511 |
| 1800 | bb | hearts | 3,803 | 1 | 3,803 |
| 1824 | bb | hearts | 3,878 | 1 | 3,878 |
| 1325 | cc | hearts | 6,879 | 1 | 6,879 |
| 3427 | cc | spade | 7,261 | 2.5 | 18,153 |
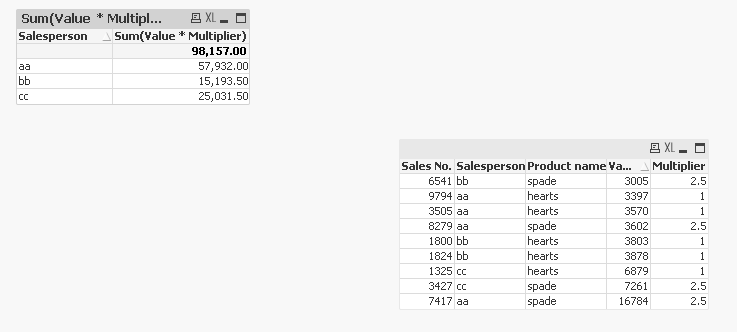
I would like to show the above in a pivot table in a chart of each salesperson the total sales they have done after the multiplier.
| Salesperson | $aft multiplier |
| aa | 57,931.00 |
| bb | 15,192.00 |
| cc | 25,031.00 |
I have tried using AGGR funtion and TOTAL separately but to no avail. Is it that I have to sum or condition it by the Multiplier. If so how do I that?
Could someone advise on the correct use of AGGR in this case and my TOTAL use for this as well?
Some expressions that I have tried that doesnt work
Sum($)*Multiplier
Sum(TOTAL <[Salesperson]> $)
AGGR(sum($),[Salesperson])*Multiplier
Thanks
Accepted Solutions
- Mark as New
- Bookmark
- Subscribe
- Mute
- Subscribe to RSS Feed
- Permalink
- Report Inappropriate Content
What about
=Sum( [$] * Multiplier )
in a chart with dimension Salesperson.
If that doesn't work, then please describe your data model a bit closer, and post some sample data.
- Mark as New
- Bookmark
- Subscribe
- Mute
- Subscribe to RSS Feed
- Permalink
- Report Inappropriate Content
Try this
Sum($*Multiplier)
- Mark as New
- Bookmark
- Subscribe
- Mute
- Subscribe to RSS Feed
- Permalink
- Report Inappropriate Content
What about
=Sum( [$] * Multiplier )
in a chart with dimension Salesperson.
If that doesn't work, then please describe your data model a bit closer, and post some sample data.
- Mark as New
- Bookmark
- Subscribe
- Mute
- Subscribe to RSS Feed
- Permalink
- Report Inappropriate Content
Sample attached
- Mark as New
- Bookmark
- Subscribe
- Mute
- Subscribe to RSS Feed
- Permalink
- Report Inappropriate Content
Hi
I am trying one step further to aggregrate the total salesperson $(based on sales with multiplier) at firm level. I have expanded my data as below.
How do I get the total qualifiers at firm level after the above has been achieved?
| Sales No. | Salesperson | Product name | $ | Mulitplier | Firm Name |
| 3505 | aa | hearts | 3,570 | 1.0 | Aces |
| 7417 | aa | spade | 16,784 | 2.5 | Aces |
| 8279 | aa | spade | 3,602 | 2.5 | Aces |
| 9794 | aa | hearts | 3,397 | 1.0 | Aces |
| 6541 | bb | spade | 3,005 | 1.0 | Brook |
| 1800 | bb | hearts | 3,803 | 1.0 | Brook |
| 1824 | bb | hearts | 3,878 | 1.0 | Brook |
| 1325 | cc | hearts | 6,879 | 1.0 | Aces |
| 3427 | cc | spade | 7,261 | 2.5 | Aces |
| 3795 | ee | hearts | 4,500 | 1.0 | Dice |
| 4568 | ee | spade | 7,000 | 2.5 | Dice |
| 5398 | ff | spade | 5,000 | 2.5 | Dice |
| 6756 | ff | spade | 8,700 | 2.5 | Dice |
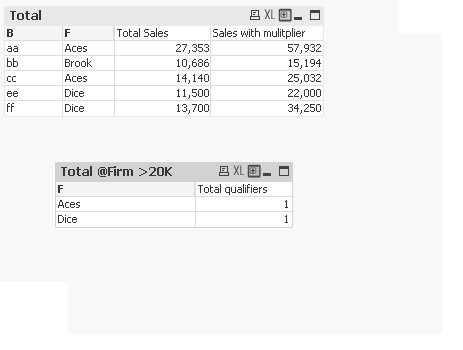
The criteria is if the salesperson achieves more than $20,000, it will be considered as one qualifier for the firm.
in this case, there should be 2 qualifiers each from Aces and Dices.
Is this expression correct to do the aggregration?
if(sum(
Thanks
- Mark as New
- Bookmark
- Subscribe
- Mute
- Subscribe to RSS Feed
- Permalink
- Report Inappropriate Content
Maybe something like this, using advanced aggregation
=Sum( Aggr( If( Sum( [$]*[Multiplier]) > 20000, 1,0), Firm, [Salesperson]))
or this using an advanced search in a set expression
=Count({<[Salesperson] = {"=Sum( [$]*[Multiplier]) > 20000"}>} DISTINCT [Salesperson])
Double check that the field names are spelled exactely like in your model.