Unlock a world of possibilities! Login now and discover the exclusive benefits awaiting you.
- Qlik Community
- :
- All Forums
- :
- QlikView App Dev
- :
- Re: Top 5 records group by 2 dims in stright table...
- Subscribe to RSS Feed
- Mark Topic as New
- Mark Topic as Read
- Float this Topic for Current User
- Bookmark
- Subscribe
- Mute
- Printer Friendly Page
- Mark as New
- Bookmark
- Subscribe
- Mute
- Subscribe to RSS Feed
- Permalink
- Report Inappropriate Content
Top 5 records group by 2 dims in stright table and bar chart
Hi , below is my source data:
| Year | Loc | Sales |
| 2015 | a | 100 |
| 2015 | b | 250 |
| 2015 | c | 50 |
| 2016 | a | 250 |
| 2016 | b | 200 |
| 2016 | c | 350 |
| 2016 | d | 10 |
| 2017 | a | 300 |
| 2017 | b | 100 |
| 2017 | c | 400 |
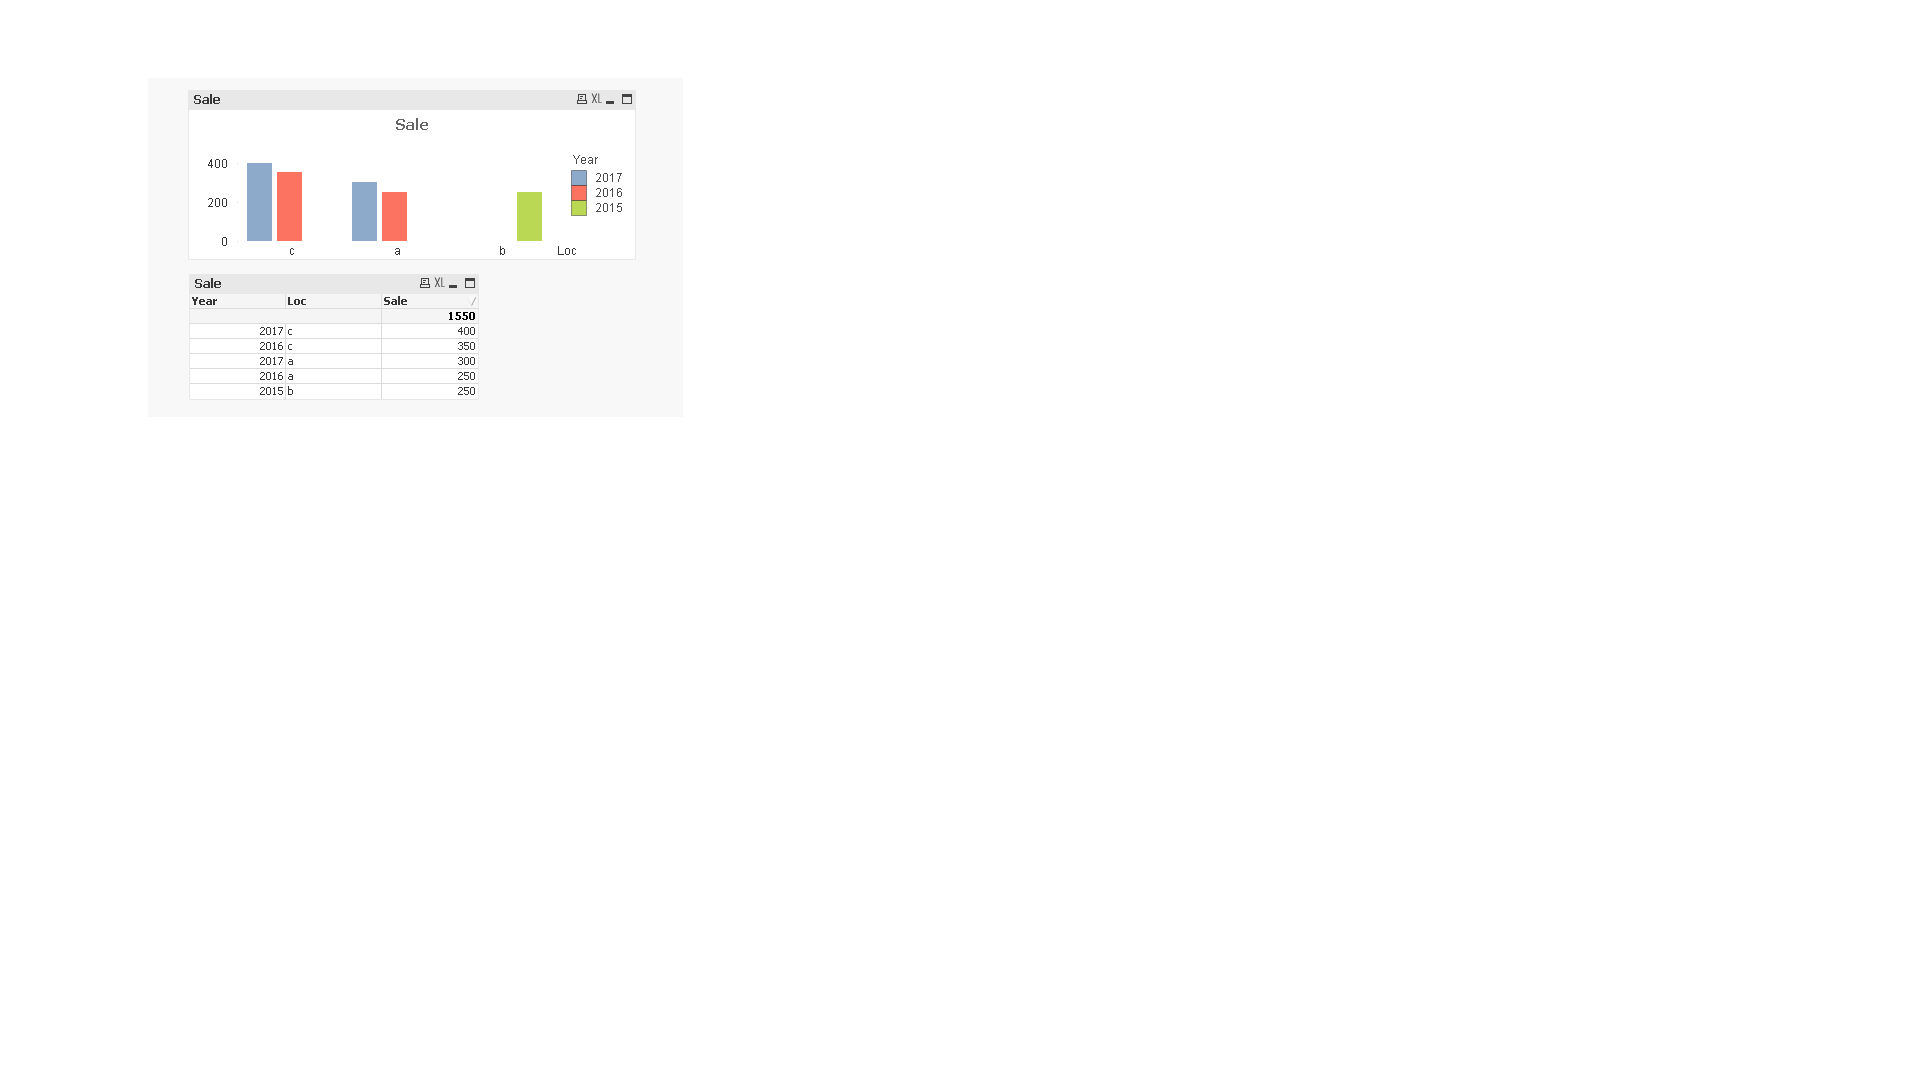
need to display output stright table:
| Year | Loc | Sales |
| 2017 | c | 400 |
| 2017 | a | 300 |
| 2016 | c | 350 |
| 2016 | a | 250 |
| 2015 | b | 250 |
same output in bar chart also please find the attachment required format.
Requirement is :Year & Loc are dimensions and expressions is :sum(Sales)
i have to display top 5 Loc records based on sum(Sales) and then order by Year
i have tried all the possible ways like order by sum(sales) desc and dimension limit but no luck.
- Mark as New
- Bookmark
- Subscribe
- Mute
- Subscribe to RSS Feed
- Permalink
- Report Inappropriate Content
Try this expression.
Sum ({<Sales = {'=Rank(Sum(Sales),0,4)<=5'}>}Sales)
Regards,
Kaushik Solanki
- Mark as New
- Bookmark
- Subscribe
- Mute
- Subscribe to RSS Feed
- Permalink
- Report Inappropriate Content
Hi Kaushal
Can you please explain this set expression?
- Mark as New
- Bookmark
- Subscribe
- Mute
- Subscribe to RSS Feed
- Permalink
- Report Inappropriate Content

- Mark as New
- Bookmark
- Subscribe
- Mute
- Subscribe to RSS Feed
- Permalink
- Report Inappropriate Content
Check this as Koushik suggested
- Mark as New
- Bookmark
- Subscribe
- Mute
- Subscribe to RSS Feed
- Permalink
- Report Inappropriate Content
Hi,
It says that give the sum of Sales where the rank of the sales if below 5.
Regards,
Kaushik Solanki
- Mark as New
- Bookmark
- Subscribe
- Mute
- Subscribe to RSS Feed
- Permalink
- Report Inappropriate Content
Rank(0,4) what this means?
I am bit confused in rank function
- Mark as New
- Bookmark
- Subscribe
- Mute
- Subscribe to RSS Feed
- Permalink
- Report Inappropriate Content
Hi Kaushik ... as Shivesh asked what this Rank(0,4) indicates
Because the below expression as well giving the same output with out 0,4
Sum ({<Sales = {'=Rank(Sum(Sales))<=5'}>}Sales)
- Mark as New
- Bookmark
- Subscribe
- Mute
- Subscribe to RSS Feed
- Permalink
- Report Inappropriate Content
hi Kaushik, thanks for support,for single expression its working fine,suppose if i use 2 expressions then i am not getting proper output.can u please check by adding dummy expression in chart level.PFA....