Unlock a world of possibilities! Login now and discover the exclusive benefits awaiting you.
- Qlik Community
- :
- All Forums
- :
- QlikView App Dev
- :
- Re: Top customers on basis of percentage % ?
- Subscribe to RSS Feed
- Mark Topic as New
- Mark Topic as Read
- Float this Topic for Current User
- Bookmark
- Subscribe
- Mute
- Printer Friendly Page
- Mark as New
- Bookmark
- Subscribe
- Mute
- Subscribe to RSS Feed
- Permalink
- Report Inappropriate Content
Top customers on basis of percentage % ?
HI All,
I need to get top 25% of customers, on the basis of percentage from the Total Sales Value..
The customers who has having Sum of top % should be <= 25%, Required in PIVOT Table..
Kindly find the sample excel file along with the Input & Output..
Kindly help me on this.
Thanks,
Helen
- Tags:
- qlikview_scripting
- Mark as New
- Bookmark
- Subscribe
- Mute
- Subscribe to RSS Feed
- Permalink
- Report Inappropriate Content
Helen, do you really need a Pivot table?
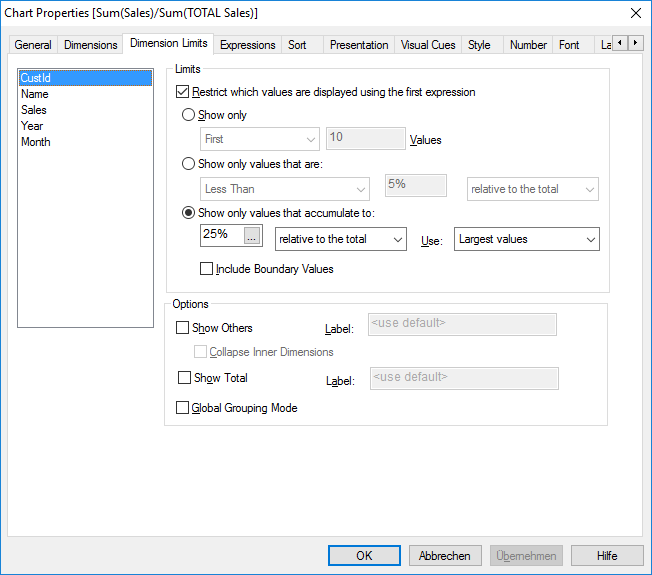
If a straight table will do, you can use the dimension limits:

- Mark as New
- Bookmark
- Subscribe
- Mute
- Subscribe to RSS Feed
- Permalink
- Report Inappropriate Content
Hi Swuehl,
Thanks.. But I really need in PIVOT Table .
Kindly help me on this..
Regards,
Helen
- Mark as New
- Bookmark
- Subscribe
- Mute
- Subscribe to RSS Feed
- Permalink
- Report Inappropriate Content
Attached a script based solution (since you asked in script section of the forum 😉 and a pivot table chart showing the requested result.
- Mark as New
- Bookmark
- Subscribe
- Mute
- Subscribe to RSS Feed
- Permalink
- Report Inappropriate Content
Thanks swuehl exactly what i need.
Is it possible to create on Sale Value other than Sales %, Can't we do it in Front End Chart with the help of Variables using Rangesum which used in backend ?
Regards,
Helen
- Mark as New
- Bookmark
- Subscribe
- Mute
- Subscribe to RSS Feed
- Permalink
- Report Inappropriate Content
Helen,
attached another version where I calculate the sales % in the script as well as a purely front end solution using rangesum.
- Mark as New
- Bookmark
- Subscribe
- Mute
- Subscribe to RSS Feed
- Permalink
- Report Inappropriate Content
Thanks swuehl.
Here it is working fine In my case it was not working.
I need to show show top25% customers in the Year 2015 in Calc dim, with the bifurcation of 2016 Sales for that specific customers.
In the Excel file haven't provided 2016, can you Include for 2016 sales & can you show
Kindly help me on this.
Regards,
Helen
- Mark as New
- Bookmark
- Subscribe
- Mute
- Subscribe to RSS Feed
- Permalink
- Report Inappropriate Content
sum(sales)/sum(total sales)