Unlock a world of possibilities! Login now and discover the exclusive benefits awaiting you.
- Qlik Community
- :
- All Forums
- :
- QlikView App Dev
- :
- Re: Total Open Tickets per Day - Barchart
- Subscribe to RSS Feed
- Mark Topic as New
- Mark Topic as Read
- Float this Topic for Current User
- Bookmark
- Subscribe
- Mute
- Printer Friendly Page
- Mark as New
- Bookmark
- Subscribe
- Mute
- Subscribe to RSS Feed
- Permalink
- Report Inappropriate Content
Total Open Tickets per Day - Barchart
Hello,
I need an Idea/Solution for the following ...
A barchart should show the total amount of Open Tickets per day (actually for other timevalues as well like week or month).
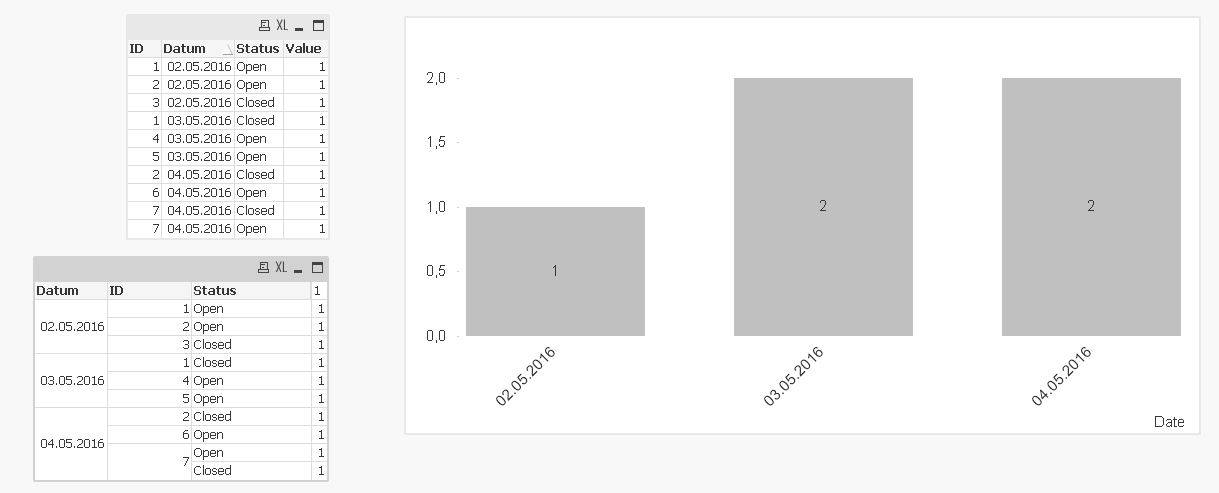
The formula I use right now doesn't show correct values for the first bar in the chart. For all other days e.g. the correct values will be shown.
Any Idea/Solution to show the correct value for the first bar as well would be welcome.
Thanks a lot ...
Thomas
- Mark as New
- Bookmark
- Subscribe
- Mute
- Subscribe to RSS Feed
- Permalink
- Report Inappropriate Content
Try to create an interval using your single dates records, then create reference dates for each ticket and use the reference date as dimension for your open count:
- Mark as New
- Bookmark
- Subscribe
- Mute
- Subscribe to RSS Feed
- Permalink
- Report Inappropriate Content
well ... these concepts doesn't help here ....
- Mark as New
- Bookmark
- Subscribe
- Mute
- Subscribe to RSS Feed
- Permalink
- Report Inappropriate Content
Hi Thomas,
Something like this?
Cheers,
Michiel
- Mark as New
- Bookmark
- Subscribe
- Mute
- Subscribe to RSS Feed
- Permalink
- Report Inappropriate Content
Are you expecting each bar to show 2, i.e. count(Status) - [New Tickets]?
- Mark as New
- Bookmark
- Subscribe
- Mute
- Subscribe to RSS Feed
- Permalink
- Report Inappropriate Content
Thomas Rieck <span class="icon-status-icon icon-partner" title="Partner"></span> wrote:
well ... these concepts doesn't help here ....
Why not? Isn't the chart that Henric showed in his reference date blog post exactely what you would like to see?
Just link a Master Calendar to the reference date field and you can show your open tickets by Date, Week, Month etc. easily.
- Mark as New
- Bookmark
- Subscribe
- Mute
- Subscribe to RSS Feed
- Permalink
- Report Inappropriate Content
I think I need do something like this ...
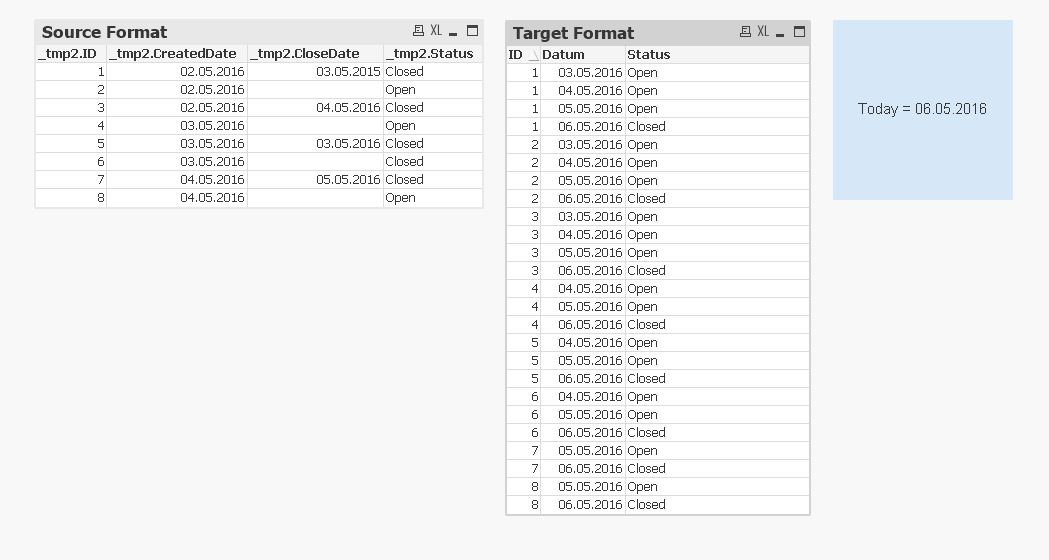
and do a count on the target format table .... actually I wanted to avoid that since I produce more datasets ...
- Mark as New
- Bookmark
- Subscribe
- Mute
- Subscribe to RSS Feed
- Permalink
- Report Inappropriate Content
To me it looks like this is the right path (and btw, this is what the blog posts describe.
For the Open tickets, I think you should fill in a CloseDate like Today().
Again, it's all pretty well explained in the two blog posts and the referenced tech doc.