Unlock a world of possibilities! Login now and discover the exclusive benefits awaiting you.
- Qlik Community
- :
- All Forums
- :
- QlikView App Dev
- :
- Re: Turning an IF Statement to Set Analysis
- Subscribe to RSS Feed
- Mark Topic as New
- Mark Topic as Read
- Float this Topic for Current User
- Bookmark
- Subscribe
- Mute
- Printer Friendly Page
- Mark as New
- Bookmark
- Subscribe
- Mute
- Subscribe to RSS Feed
- Permalink
- Report Inappropriate Content
Turning an IF Statement to Set Analysis
I have a very simple structure, as follows:
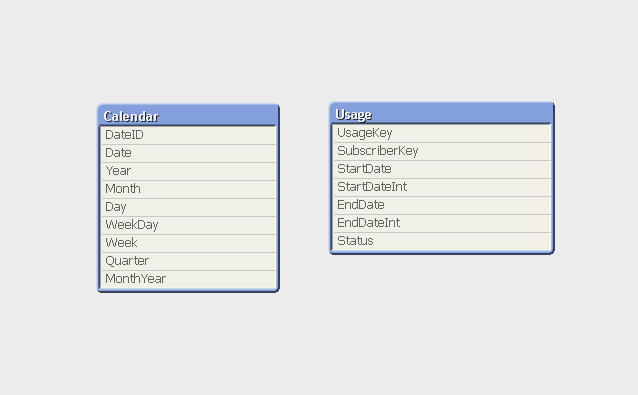
and I am achieving my objective of plotting a calendar dimension on the X-axis and the following expression on the x-axis:
= count(distinct if(StartDateInt <= DateID and EndDateInt >= DateID and Status = 3, SubscriberKey))
This is VERY SLOW so I am trying to define the expression using SET ANALYSIS
The following is my attempt which does not appear to work - ANY HELP WOULD BE APPRECIATED.
= count(distinct
{<
[StartDateInt] = {"<=(DateID)"},
[EndDateInt] = {">=(DateID)"},
[Status] = {3}
>}
SubscriberKey)
- Tags:
- set-analysis
- « Previous Replies
-
- 1
- 2
- Next Replies »
- Mark as New
- Bookmark
- Subscribe
- Mute
- Subscribe to RSS Feed
- Permalink
- Report Inappropriate Content
Isn't it possible to create a Date Calendar for your fact table?
Using Iceland table and if together will always give you poor performance...
- Mark as New
- Bookmark
- Subscribe
- Mute
- Subscribe to RSS Feed
- Permalink
- Report Inappropriate Content
Hi
I agree with you 100% but as as I should have mentioned this is a simplified extract from a very large application that, for reasons that are too complex to explain here, the calendar needs to be disjointed from the fact table - after all this is why we have Set Analysis!
Thanks for taking the time to respond
Alexis
- Mark as New
- Bookmark
- Subscribe
- Mute
- Subscribe to RSS Feed
- Permalink
- Report Inappropriate Content
Hi Alexis,
Did you select only one DateID? Because in your expression <=(DateID) if you have several DateID it will not work just because will be represented as <=(Only(DateID)) and if you have several of them you will get Null().
As an option you can try to use Max(DateID) instead of DateID.
Regards,
Sergey
Sergey
- Mark as New
- Bookmark
- Subscribe
- Mute
- Subscribe to RSS Feed
- Permalink
- Report Inappropriate Content
Hi Sergey
Using the IF statement I get the right results irrespective of the range of dates selected.
Removing the DISTINCT speeds things up but I need to calculate DISTINCT so that is back in
I cannot see how I can write this (and to work) using SET ANALYSIS
best regards
Alexis
- Mark as New
- Bookmark
- Subscribe
- Mute
- Subscribe to RSS Feed
- Permalink
- Report Inappropriate Content
Hi Alexis,
What is the working if statement? Could you show it? 
And you didn't answer my question:
Did you select only one DateID?
Regards,
Sergey
Sergey
- Mark as New
- Bookmark
- Subscribe
- Mute
- Subscribe to RSS Feed
- Permalink
- Report Inappropriate Content
Sergey
The working IF statement is in the question - here it is again:
count(distinct IF(StartDateInt <= DateID and EndDateInt >= DateID and Status = 3, SubscriberKey))
It works whether I select a year,a quarter, a month,a week or a date or date range
BR
Alexis
- Mark as New
- Bookmark
- Subscribe
- Mute
- Subscribe to RSS Feed
- Permalink
- Report Inappropriate Content
Hi,
Is DateID a fixed value or something that depends on the transaction?
The problem with your lines like [StartDateInt] = {"<=(DateID)"}, is that "<=" is doing a search - not a selection.
if it is a fixed value you could for example use a dollar sign expansion
= $(='count(distinct
{<
[StartDateInt] = {"<=' & DateID & '"},
[EndDateInt] = {">=' & DateID & '"},
[Status] = {3}
>}
SubscriberKey)'
How is the data model? Is it possible to instead flag the correct lines in the script?
- Mark as New
- Bookmark
- Subscribe
- Mute
- Subscribe to RSS Feed
- Permalink
- Report Inappropriate Content
Alexis,
As I understood, you need to calculate Amount of Subscribers in Year or Month or Day and show these numbers on the chart.
So, it's better to rebuild the data model and calculate with just simple Sum() or Count() without any IF or Set Analysis with the table like:
Date SubsKey Status
I can do it for you if you post a sample of your data.
Regards,
Sergey
Sergey
- Mark as New
- Bookmark
- Subscribe
- Mute
- Subscribe to RSS Feed
- Permalink
- Report Inappropriate Content
Hi Sergey
Here are a few things to help with the issue
a) I have a calendar table that needs to be separated from the fact table - this is too complex to explain but trust me that this is how it needs to be designed
b) I have a table (see Usage.qvd) which has a number of records - each record has a subscriber id, a start date an end date and the status for that period.
c) A subscriber therefore can have a number of records to reflect the various status that it has passed say from Active (Status 3) to Inactive (Status 1) and back Active for example
d) I need to build a chart that on the x axis has the date element (year, quarter, Month week etc) and on the y-axis number of DISTINCT subscribers that have been active (Status of 3) for the chosen period
Below are the 2 qvds you need
- « Previous Replies
-
- 1
- 2
- Next Replies »