Unlock a world of possibilities! Login now and discover the exclusive benefits awaiting you.
- Qlik Community
- :
- All Forums
- :
- QlikView App Dev
- :
- Turning an IF Statement to Set Analysis
- Subscribe to RSS Feed
- Mark Topic as New
- Mark Topic as Read
- Float this Topic for Current User
- Bookmark
- Subscribe
- Mute
- Printer Friendly Page
- Mark as New
- Bookmark
- Subscribe
- Mute
- Subscribe to RSS Feed
- Permalink
- Report Inappropriate Content
Turning an IF Statement to Set Analysis
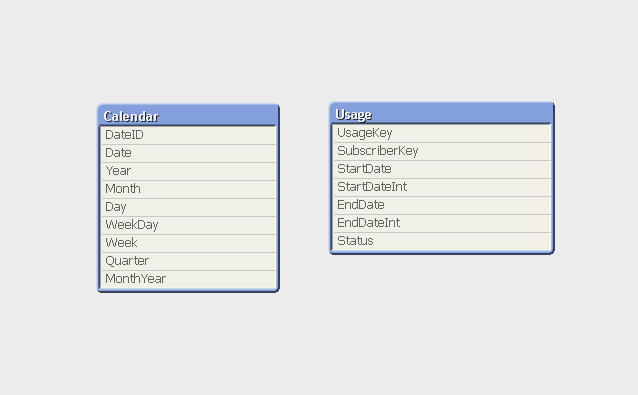
I have a very simple structure, as follows:
and I am achieving my objective of plotting a calendar dimension on the X-axis and the following expression on the x-axis:
= count(distinct if(StartDateInt <= DateID and EndDateInt >= DateID and Status = 3, SubscriberKey))
This is VERY SLOW so I am trying to define the expression using SET ANALYSIS
The following is my attempt which does not appear to work - ANY HELP WOULD BE APPRECIATED.
= count(distinct
{<
[StartDateInt] = {"<=(DateID)"},
[EndDateInt] = {">=(DateID)"},
[Status] = {3}
>}
SubscriberKey)
- Tags:
- set-analysis
- « Previous Replies
-
- 1
- 2
- Next Replies »
- Mark as New
- Bookmark
- Subscribe
- Mute
- Subscribe to RSS Feed
- Permalink
- Report Inappropriate Content
Hi Morgan
As I explained this is a simplification of a small part of a large project - the data structure is as above - 2 tables (see data (Qvd files) that I attached for Sergey earlier), Calendar and Usage that need to be kept unassociated.
I need to build a chart that on the x axis has the date element (year, quarter, Month week etc) and on the y-axis number of DISTINCT subscribers that have been active (Status of 3) for the chosen period
Thanks
Alexis
- Mark as New
- Bookmark
- Subscribe
- Mute
- Subscribe to RSS Feed
- Permalink
- Report Inappropriate Content
Alexis,
PFA my solution.
I think it's better to add additional calendar just to decrease data in the LinkTable.
I built the linkable for all Statues, but you can easily filter it and make it smaller if you need it only for Status=3.
Just reload the data from your qvd. I reduced the data in this file to load it here.
Regards,
Sergey
Sergey
- Mark as New
- Bookmark
- Subscribe
- Mute
- Subscribe to RSS Feed
- Permalink
- Report Inappropriate Content
OK. So the two tables are not connected at all? How many rows do you have in each of the tables in the real case? Since they are not connected QlikView will generate a Cartesian product and consume a LOT of memory and cpu.
Since you have the calendar as X-axis the value of DateID will be different for each dimensional point. Set analysis however is calculated once for the whole set of dimensional values. You can not have a set analysis that takes the current dimensional value into account.
Without changing your data model I don't think you can solve this.
- « Previous Replies
-
- 1
- 2
- Next Replies »