Unlock a world of possibilities! Login now and discover the exclusive benefits awaiting you.
- Qlik Community
- :
- All Forums
- :
- QlikView App Dev
- :
- Re: Re: Two IntervalMatch 's in one qvw
- Subscribe to RSS Feed
- Mark Topic as New
- Mark Topic as Read
- Float this Topic for Current User
- Bookmark
- Subscribe
- Mute
- Printer Friendly Page
- Mark as New
- Bookmark
- Subscribe
- Mute
- Subscribe to RSS Feed
- Permalink
- Report Inappropriate Content
Two IntervalMatch 's in one qvw
Hi
I have 2 Fact tables, one of which is planned work hours and the other actual work hours.
From this I need to know how many people were planned to be onsite in 15 minute intervals, and the same for actual.
The IntervalMatch() function sorts this fine........
................ but I also need to be able to slice this against various dimensions such as Department.
In the attached qvw [which has a sample Inline Load] you will see that this works fine as long as the Department is selected from both Fact tables. However it is painful to have to select the Department twice.
I tried to concatenate the pairs of Fact and Interval tables and renaming both Department A & B as Department, but I could not get that working.
Does anybody have any suggestions ?
Note: In my real data I have a fair few million rows.
Many Thanks, Bill
Accepted Solutions
- Mark as New
- Bookmark
- Subscribe
- Mute
- Subscribe to RSS Feed
- Permalink
- Report Inappropriate Content
Hi Bill,
sorry for not getting the point in the first place.
I tried for another solution and came up with this:
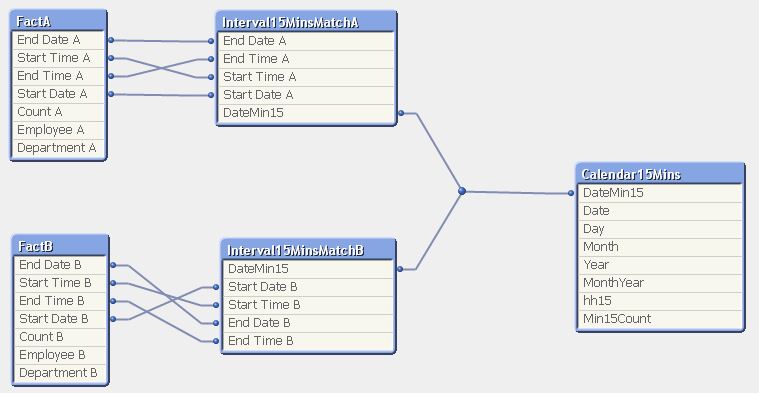
I converted your data model

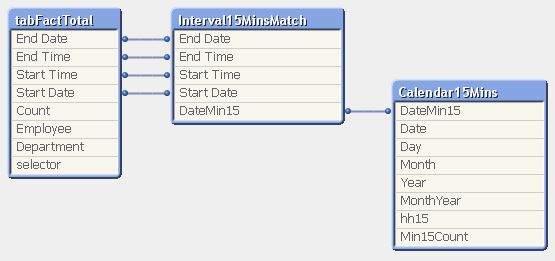
into this

To do so, I skipped your interval match code and combined the FactA and FactB tables using this script:
tabFactTotal:
LOAD
  [Count A] as Count,
  [Employee A] as Employee,
  [Department A] as Department,
  [Start Date A] as [Start Date],
  [Start Time A] as [Start Time],
  [Start DateTime A] as [Start DateTime],
  [End Date A] as [End Date],
  [End Time A] as [End Time],
  [End DateTime A] as [End DateTime],
  'A' as selector
Resident FactA;

LOAD
  [Count B] as Count,
  [Employee B] as Employee,
  [Department B] as Department,
  [Start Date B] as [Start Date],
  [Start Time B] as [Start Time],
  [Start DateTime B] as [Start DateTime],
  [End Date B] as [End Date],
  [End Time B] as [End Time],
  [End DateTime B] as [End DateTime],
  'B' as selector
Resident FactB;

TempInterval15MinsMatch:
INTERVALMATCH (DateMin15)
LOAD
[Start DateTime],
[End DateTime]
Resident tabFactTotal;

Interval15MinsMatch:
load
  date(floor([Start DateTime]  )) as  [Start Date] ,
  time(frac([Start DateTime]  )) as  [Start Time] ,
  date(floor([End DateTime]  )) as  [End Date] ,
  time(frac([End DateTime]  )) as  [End Time] ,
  DateMin15
Resident TempInterval15MinsMatch;

drop tables TempInterval15MinsMatch, FactA, FactB;
drop field  [Start DateTime] ;
drop field  [End DateTime] ;
The result looks like this:


The department selection now is possible with only one field.
Your chart expressions had to be extended with a set expression, e.g.:
sum ( [Count A] )
became
sum ({$<selector={'A'}>} [Count] )
hope this helps
regards
Marco
- Mark as New
- Bookmark
- Subscribe
- Mute
- Subscribe to RSS Feed
- Permalink
- Report Inappropriate Content
Hi Bill,
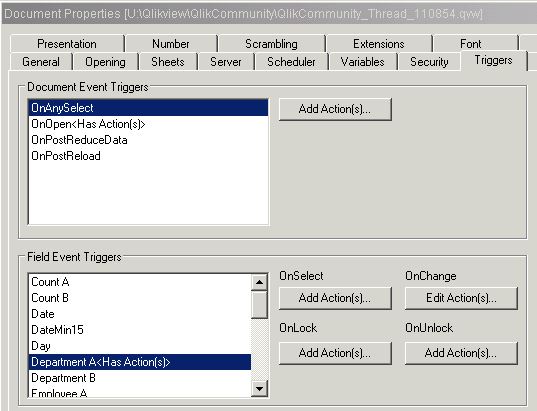
you could add some triggers and actions which replicate the selection state e.g. from field [Department A] to [Department B] like this:


=GetFieldSelections([Department A])
but personally I think that's your second best option.
I would prefer integrating your two fact tables into one and add one field that distincts the initial source table (A/B) which then could be used as additional dimension in your charts.
regards
Marco
- Mark as New
- Bookmark
- Subscribe
- Mute
- Subscribe to RSS Feed
- Permalink
- Report Inappropriate Content
Marco
Many thanks for your reply.
I completely agree with you that integrating the two fact tables into one would be good, I just can't get it work though, any suggestion to make it would work would be gratefully received, there is a sample qvw attached to the original post.
Best Regards, Bill
- Mark as New
- Bookmark
- Subscribe
- Mute
- Subscribe to RSS Feed
- Permalink
- Report Inappropriate Content
Hi Bill,
sorry for not getting the point in the first place.
I tried for another solution and came up with this:
I converted your data model

into this

To do so, I skipped your interval match code and combined the FactA and FactB tables using this script:
tabFactTotal:
LOAD
  [Count A] as Count,
  [Employee A] as Employee,
  [Department A] as Department,
  [Start Date A] as [Start Date],
  [Start Time A] as [Start Time],
  [Start DateTime A] as [Start DateTime],
  [End Date A] as [End Date],
  [End Time A] as [End Time],
  [End DateTime A] as [End DateTime],
  'A' as selector
Resident FactA;

LOAD
  [Count B] as Count,
  [Employee B] as Employee,
  [Department B] as Department,
  [Start Date B] as [Start Date],
  [Start Time B] as [Start Time],
  [Start DateTime B] as [Start DateTime],
  [End Date B] as [End Date],
  [End Time B] as [End Time],
  [End DateTime B] as [End DateTime],
  'B' as selector
Resident FactB;

TempInterval15MinsMatch:
INTERVALMATCH (DateMin15)
LOAD
[Start DateTime],
[End DateTime]
Resident tabFactTotal;

Interval15MinsMatch:
load
  date(floor([Start DateTime]  )) as  [Start Date] ,
  time(frac([Start DateTime]  )) as  [Start Time] ,
  date(floor([End DateTime]  )) as  [End Date] ,
  time(frac([End DateTime]  )) as  [End Time] ,
  DateMin15
Resident TempInterval15MinsMatch;

drop tables TempInterval15MinsMatch, FactA, FactB;
drop field  [Start DateTime] ;
drop field  [End DateTime] ;
The result looks like this:


The department selection now is possible with only one field.
Your chart expressions had to be extended with a set expression, e.g.:
sum ( [Count A] )
became
sum ({$<selector={'A'}>} [Count] )
hope this helps
regards
Marco
- Mark as New
- Bookmark
- Subscribe
- Mute
- Subscribe to RSS Feed
- Permalink
- Report Inappropriate Content
Marco
Many thanks for that cunning suggestion, it looks promising and I am optimistic.
I just need to check it out.
Best Regards, Bill
- Mark as New
- Bookmark
- Subscribe
- Mute
- Subscribe to RSS Feed
- Permalink
- Report Inappropriate Content
Marco
Wow !!!! Many, many thanks.
I have incorporated your solution into my real qvw with my real data and it is working perfectly.
Your cunning bit was to concatenate the 2 Fact tables before the IntervalMatch.
Best Regards, Bill
- Mark as New
- Bookmark
- Subscribe
- Mute
- Subscribe to RSS Feed
- Permalink
- Report Inappropriate Content
glad I could help
regards
Marco