Unlock a world of possibilities! Login now and discover the exclusive benefits awaiting you.
- Qlik Community
- :
- All Forums
- :
- QlikView App Dev
- :
- Re: Value doesn't match
- Subscribe to RSS Feed
- Mark Topic as New
- Mark Topic as Read
- Float this Topic for Current User
- Bookmark
- Subscribe
- Mute
- Printer Friendly Page
- Mark as New
- Bookmark
- Subscribe
- Mute
- Subscribe to RSS Feed
- Permalink
- Report Inappropriate Content
Value doesn't match
Hi All,
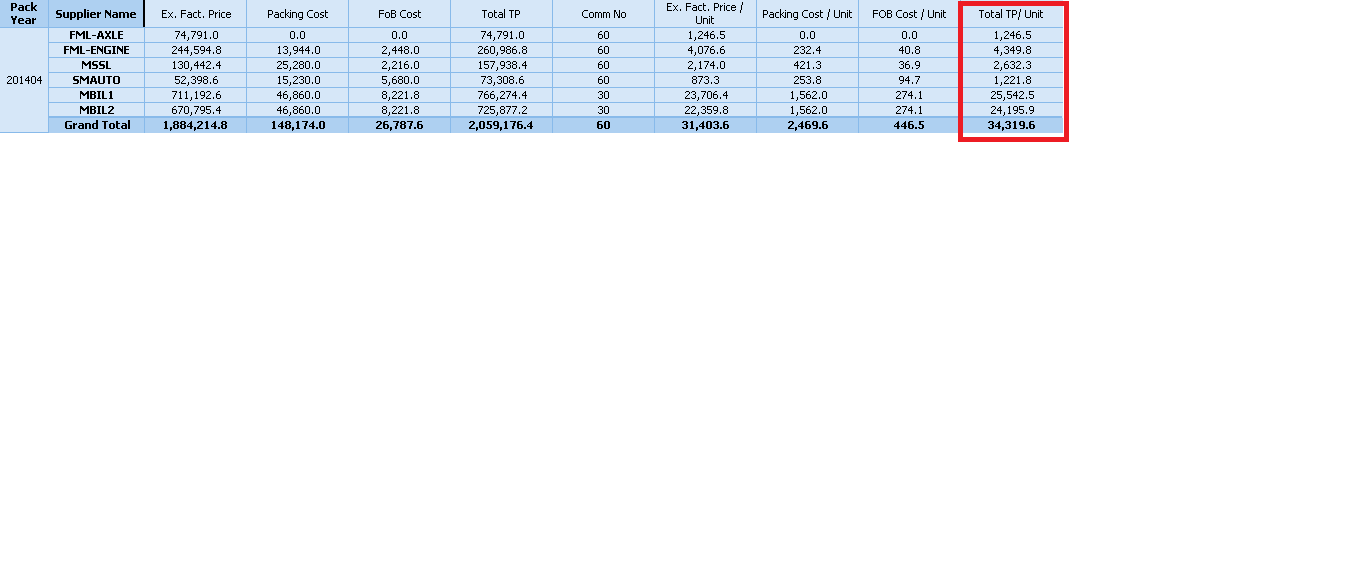
I have one bar chart and pivot table in that i have used same dimension and expression but why value has changed.
PFA for the same


Thanks
Prashant
- « Previous Replies
-
- 1
- 2
- Next Replies »
- Mark as New
- Bookmark
- Subscribe
- Mute
- Subscribe to RSS Feed
- Permalink
- Report Inappropriate Content
I'm working on personal edtion so can not open the file but if you can post your data,espression & dimension I can have a look
- Mark as New
- Bookmark
- Subscribe
- Mute
- Subscribe to RSS Feed
- Permalink
- Report Inappropriate Content
What is the expression you are using to calculate Total TP/Unit in your pivot table? If it is any other then Sum, then you will need to use an aggregate function like this:
=Sum(Aggr(yourExpression, [Pack Year], [Supplier Name]))
Note: The above expression is assuming that you only have Pack Year and Supplier name as your dimension in the pivot table.
HTH
Best,
S
- Mark as New
- Bookmark
- Subscribe
- Mute
- Subscribe to RSS Feed
- Permalink
- Report Inappropriate Content
Hi,
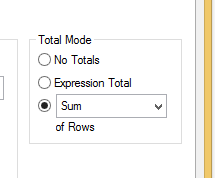
In your expression tab of pivot table, Click on Sum of rows in Total Mode.

Regards
Nandkishor S. Pandirkar
- Mark as New
- Bookmark
- Subscribe
- Mute
- Subscribe to RSS Feed
- Permalink
- Report Inappropriate Content
Hi All,
I don't want to change any expression in Bar chart I want same output as like Pivot Table.
Thanks
Prashant
- Mark as New
- Bookmark
- Subscribe
- Mute
- Subscribe to RSS Feed
- Permalink
- Report Inappropriate Content
Post your data/dimension/expression....
- Mark as New
- Bookmark
- Subscribe
- Mute
- Subscribe to RSS Feed
- Permalink
- Report Inappropriate Content
Unable to send the data
PFA for dimension/expression
- Mark as New
- Bookmark
- Subscribe
- Mute
- Subscribe to RSS Feed
- Permalink
- Report Inappropriate Content
prashantbi wrote:
Unable to send the data
You can not attached or are the confidential?
If is the first case :
Go t:

An and then:

- Mark as New
- Bookmark
- Subscribe
- Mute
- Subscribe to RSS Feed
- Permalink
- Report Inappropriate Content
Hi .
PFA for Pivot table description.
Thanks
Prashant
- Mark as New
- Bookmark
- Subscribe
- Mute
- Subscribe to RSS Feed
- Permalink
- Report Inappropriate Content
Hi,
Pivot table total will be based on the expression, so it is difficult to show that in Bar Chart and also it is not a correct value, if you sum the value in pivot table the total is not correct.
To fix the Total in Pivot table you can use you should use aggr()
Sum(Aggr(yourExpression, [Pack Year], [Supplier Name]))
Hope this helps you.
Regards,
Jagan.
- « Previous Replies
-
- 1
- 2
- Next Replies »