Unlock a world of possibilities! Login now and discover the exclusive benefits awaiting you.
- Qlik Community
- :
- All Forums
- :
- QlikView App Dev
- :
- Values of a Textbox shown in Diagramm
- Subscribe to RSS Feed
- Mark Topic as New
- Mark Topic as Read
- Float this Topic for Current User
- Bookmark
- Subscribe
- Mute
- Printer Friendly Page
- Mark as New
- Bookmark
- Subscribe
- Mute
- Subscribe to RSS Feed
- Permalink
- Report Inappropriate Content
Values of a Textbox shown in Diagramm
Hello QV Community,
please have a look at my qwv file.
I need the monthly values of a textbox to be displayed within a chart (with last 12 Month dimension)!
Or is it possible, that my Datastructure does not fit to my requirement (Do i have to transform the table in script for getting aggregated values?)
Thanks for your help
kind regards
- Mark as New
- Bookmark
- Subscribe
- Mute
- Subscribe to RSS Feed
- Permalink
- Report Inappropriate Content
Any ideas?
- Mark as New
- Bookmark
- Subscribe
- Mute
- Subscribe to RSS Feed
- Permalink
- Report Inappropriate Content
Hi Frank,
Please change the dimension of the chart to this calculated dimension:
=if(date(monthstart(CalendarYearMonthDay))>date(monthstart(addmonths(today(),-12))),CalendarYearMonth)
What I have not understood is the expression. What exactly do you need with the daten_Vorgang field?
I have summed it:
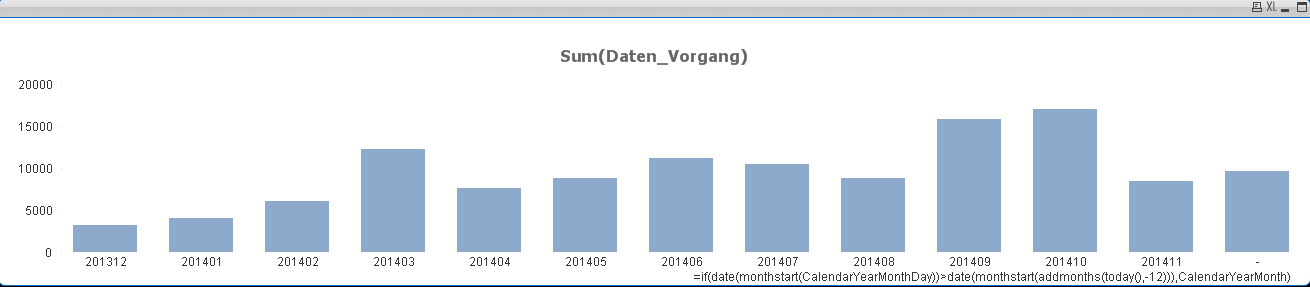
But maybe this is not the expression you need. Just let me know!
- Mark as New
- Bookmark
- Subscribe
- Mute
- Subscribe to RSS Feed
- Permalink
- Report Inappropriate Content
Hi SALTO,
thx for your reply.
I try to describe my problem more precisely. I have a excelfile with 3 columns.
First column is the date. Second column the name of the workshop and the third one (Daten_Vorgang) describes how often the workshop tried to access on our servers. The original data gives me the values by calenderweek, but i need it by month, so i connected my table with my mastercalendar.
Next step was to create a tablediagramm with the workshops as dimension.
As basic expressions I calculate :
1.) the actual monthvalues over the workshops:
=sum({$<MonthDiff={[$(vAktuellerMonat)]}>}Daten_Vorgang)
2.) the monthvalue of the month before actual month
=sum({$<MonthDiff={[$(vZeitraum2Monate)]}>}Daten_Vorgang)
3.) The monthvalue 3 month ago:
=sum({$<MonthDiff={[$(vZeitraum3Monate)]}>}Daten_Vorgang)
These expressions above I use in a fourth expression for calculating the 3 month average:
4.) (sum({$<MonthDiff={[$(vAktuellerMonat)]}>}Daten_Vorgang)+
sum({$<MonthDiff={[$(vZeitraum2Monate)]}>}Daten_Vorgang)+
sum({$<MonthDiff={[$(vZeitraum3Monate)]}>}Daten_Vorgang))/3
5.) The next Expression evaluates if the actual monthvalue is greater than the average expression in (4.)
If((sum({$<MonthDiff={[$(vAktuellerMonat)]}>Daten_Vorgang)>
sum({$<MonthDiff={[$(vAktuellerMonat)]}>Daten_Vorgang)+
sum({$<MonthDiff={[$(vZeitraum2Monate)]}>}Daten_Vorgang)+
sum({$<MonthDiff={[$(vZeitraum3Monate)]}>}Daten_Vorgang))/3,1,0)
6.) The last expression just gives me the total numbers of distinct workshops accessing the server up to now :
Count(distinct(WS_Vorgang)
For 5.) and 6.) I see a "1" in the diagramm if the condition is fullfilled otherwise "0". To see the TOTAL Value of the 1´s over all workshops, I activated the corresponding option in the diagrammsettings.
With These total values i want to create a new diagramm with a quote per month: Total value of 5.) / Total value of.6)
But no formula i am trying works untill now
The requirement is to show these quotes in a 12 month diagramm.
Hope its more clear now!
Any ideas?
- Mark as New
- Bookmark
- Subscribe
- Mute
- Subscribe to RSS Feed
- Permalink
- Report Inappropriate Content
Hi,
"Total value of 5.) / Total value of.6) " OR "Total value of 4.) / Total value of.6) "?
5) return 1 or 0, that is why I am asking...
- Mark as New
- Bookmark
- Subscribe
- Mute
- Subscribe to RSS Feed
- Permalink
- Report Inappropriate Content
Sorry again Frank,
What exactly is the quote per month: the total number of "Daten_Vorgang" that month divided per the number of Workshops that have contacted the servers, that month?
- Mark as New
- Bookmark
- Subscribe
- Mute
- Subscribe to RSS Feed
- Permalink
- Report Inappropriate Content
Hi Salto,
when you open my qvw and put the slider on the top to -1 (october) then you see the two values i marked in red on the attachment.
The left value divided by the right value should give me 100% (9/9) Quote for this month. If you put the slider to -2 (september)
then the values for this previous month should be 88,88% (8/9). And these quotes i want to show in a 12 month chart and later also showing the moving 12month avg of theses quotes !
thx for your help 