Unlock a world of possibilities! Login now and discover the exclusive benefits awaiting you.
- Qlik Community
- :
- All Forums
- :
- QlikView App Dev
- :
- Re: Variables
- Subscribe to RSS Feed
- Mark Topic as New
- Mark Topic as Read
- Float this Topic for Current User
- Bookmark
- Subscribe
- Mute
- Printer Friendly Page
- Mark as New
- Bookmark
- Subscribe
- Mute
- Subscribe to RSS Feed
- Permalink
- Report Inappropriate Content
Variables
Why does
x = sum( {< FiscalYear = {2013} >} (NetSales * SalespersonPercentage/100))
y = sum( {< FiscalYear = {2012} >} (NetSales * SalespersonPercentage/100))
sometimes not work, but
x = sum( if(FiscalYear = 2013, (NetSales * SalespersonPercentage/100)),0))
y = sum( if(FiscalYear = 2012, (NetSales * SalespersonPercentage/100)),0))
does as a Variable Definition when used in a Chart Expression as $(x)/$(y)?
Either one work and are equal when used alone
Accepted Solutions
- Mark as New
- Bookmark
- Subscribe
- Mute
- Subscribe to RSS Feed
- Permalink
- Report Inappropriate Content
If you remove the label from your percentage expression and then hover with the mouse of the expression column header, what do you see with the variables expanded? Could you make a screen shot and upload?
![2016-06-03 00_52_41-QlikView x64 - [C__Users_Stefan_Downloads_Test 02.qvw_].png](/legacyfs/online/126746_2016-06-03 00_52_41-QlikView x64 - [C__Users_Stefan_Downloads_Test 02.qvw_].png)
Besides this, does your problem application show the exact same data model or is it different?
- Mark as New
- Bookmark
- Subscribe
- Mute
- Subscribe to RSS Feed
- Permalink
- Report Inappropriate Content
Hi Scott,
When you have selected FiscalYear 2014, your expression will not work. You use $(x) to evaluate the variable on object.
I think that is better:
x = sum( {< FiscalYear = {'=$(=Max(FiscalYear))'} >} (NetSales * SalespersonPercentage/100))
y = sum( {< FiscalYear = {'=$(=Max(FiscalYear)-1)'} >} (NetSales * SalespersonPercentage/100))
When you add values on Set modifier, is better use simple commas:
x = sum( {< FiscalYear = {'2013'} >} (NetSales * SalespersonPercentage/100))
y = sum( {< FiscalYear = {'2012'} >} (NetSales * SalespersonPercentage/100))
Kind regards.
- Mark as New
- Bookmark
- Subscribe
- Mute
- Subscribe to RSS Feed
- Permalink
- Report Inappropriate Content
Thank you for the response, however it is not working in my problem application. I have created a Test application with three identical charts. In the fist I calculate everything in the object, Chart A uses variables and set analysis, Chart B uses variables and an "if statement".
Everything seems to work in the Test application attached, however in the application that I am editing Chart A fails on the % column, it only displays "-".
Also you may notice the field FiscalYear has been changed to YEAR to match the problem application. I thought that because year was also a command it may have been the issue. However, as you can see on the attachment it seems to function in the Test.
- Mark as New
- Bookmark
- Subscribe
- Mute
- Subscribe to RSS Feed
- Permalink
- Report Inappropriate Content
I think the issue might be related to the fact that the Year is coming from another table compared to SalesPersonPercentage. I am not 100% sure what the issue is, but set analysis seems to not work under some cases when the data is coming from different tables. I am not 100% sure, but may be swuehl can enlighten us
- Mark as New
- Bookmark
- Subscribe
- Mute
- Subscribe to RSS Feed
- Permalink
- Report Inappropriate Content
If you remove the label from your percentage expression and then hover with the mouse of the expression column header, what do you see with the variables expanded? Could you make a screen shot and upload?
![2016-06-03 00_52_41-QlikView x64 - [C__Users_Stefan_Downloads_Test 02.qvw_].png](/legacyfs/online/126746_2016-06-03 00_52_41-QlikView x64 - [C__Users_Stefan_Downloads_Test 02.qvw_].png)
Besides this, does your problem application show the exact same data model or is it different?
- Mark as New
- Bookmark
- Subscribe
- Mute
- Subscribe to RSS Feed
- Permalink
- Report Inappropriate Content
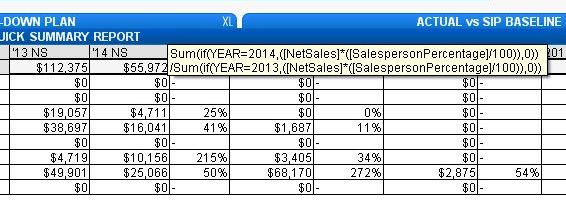
Thank you, this was incredibly helpful and I believe that I have discovered the problem.
Here is how the original application looked:

Here is what I wanted to change it to (which now functions):

My mistake was rather than replacing the expression I commented out the original expression and added mine below it:

Which resulted in the following failed expression:

- Mark as New
- Bookmark
- Subscribe
- Mute
- Subscribe to RSS Feed
- Permalink
- Report Inappropriate Content
Glad that you've got it sorted out.
That's what I've assumed, that your variables expand to something that is not a proper expression.
Comments in variables are likely to mess up expressions that are made of a combination of variables.
I usually only enter a label in the expression header after my expressions are working correctly.
Regards,
Stefan
- Mark as New
- Bookmark
- Subscribe
- Mute
- Subscribe to RSS Feed
- Permalink
- Report Inappropriate Content
I usually only enter a label in the expression header after my expressions are working correctly.
Nice advice. I will keep that in mind as well. Thanks for helping Stefan.
Best,
Sunny