Unlock a world of possibilities! Login now and discover the exclusive benefits awaiting you.
- Qlik Community
- :
- All Forums
- :
- QlikView App Dev
- :
- What is the Best way to Sort data for the followin...
- Subscribe to RSS Feed
- Mark Topic as New
- Mark Topic as Read
- Float this Topic for Current User
- Bookmark
- Subscribe
- Mute
- Printer Friendly Page
- Mark as New
- Bookmark
- Subscribe
- Mute
- Subscribe to RSS Feed
- Permalink
- Report Inappropriate Content
What is the Best way to Sort data for the following Scenario
I have Large number of Credit Card Transaction. Approximately 50,000 Transaction in one month
Some spend less than 100, some spend 20,000
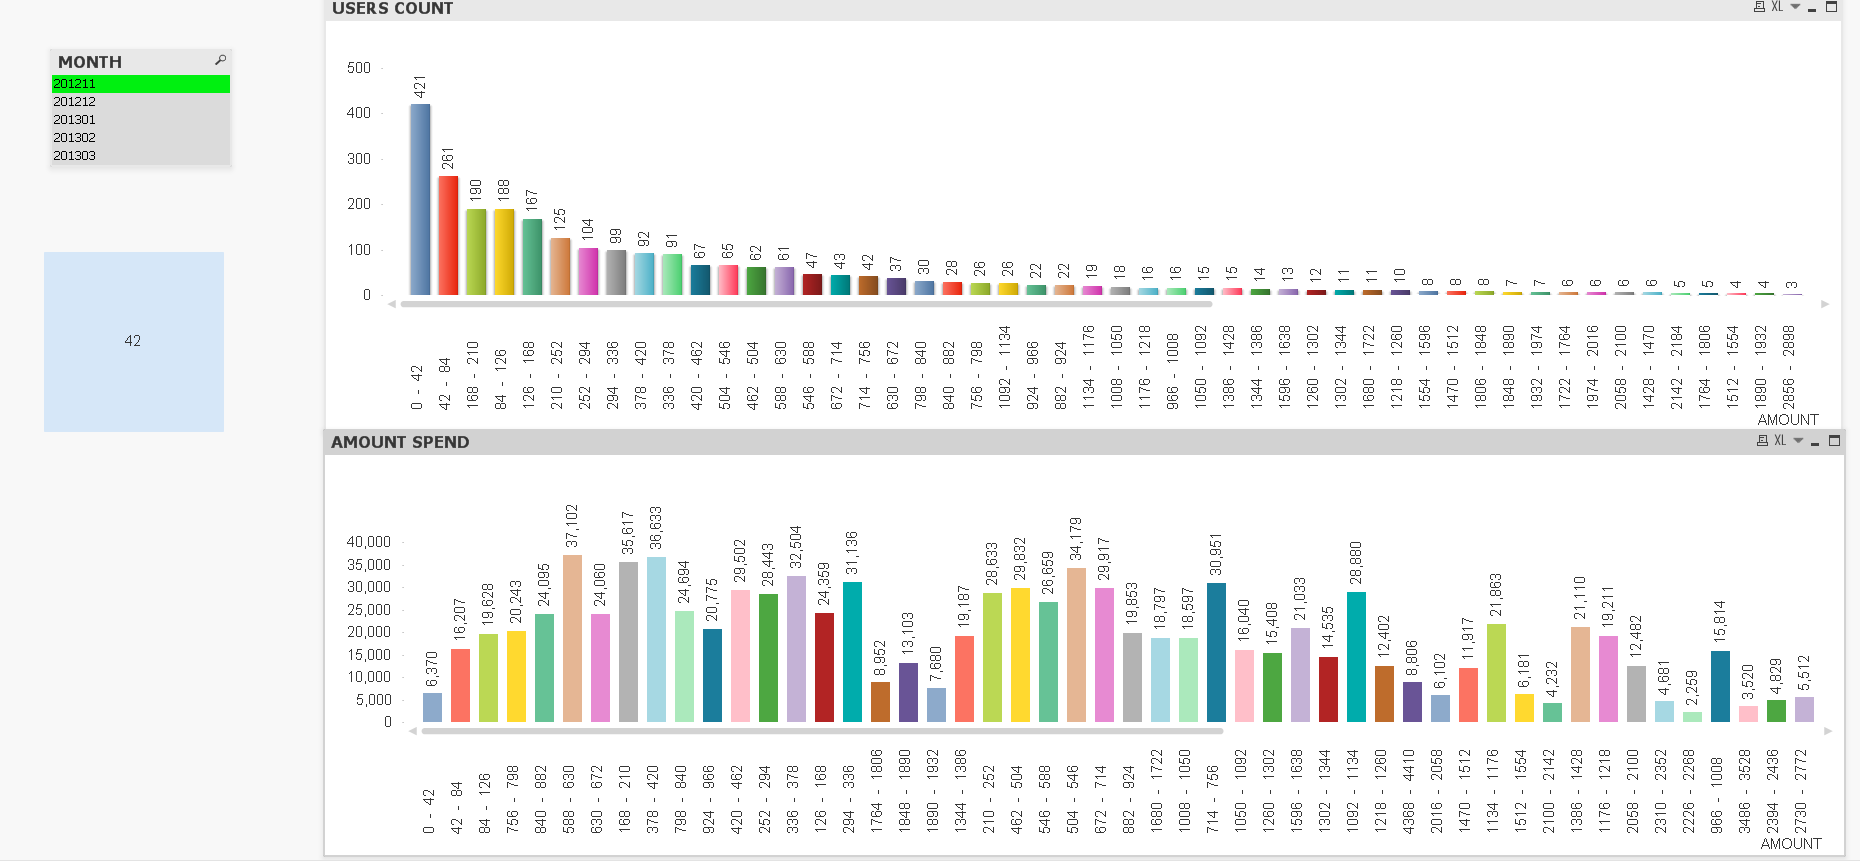
I want to show the number of users and total amount spend by the users in chart.
So I am creating two charts instead of one.
CHART 1 will have x dimesnion= Amount Spend, Y dimension = Count of Users
CHART 2 will have X dimension= Amount Spend, Y dimension = Sum of amount
For X Axis I am using a Class function to form a Range.
FInal chart is displayed as follows
My Issue is
I want user to compare top and bottom chart. I want to maintain consistent sort for X Axis. So that user can compare
example X axis should sort as follows 0-42, 42-84, 84-126, 126-169, 168-210
Similarly for Y axis
Basically I want sort based on X axis instead of Y Axis
1. How do I sort?
2. Is there any better way to show the chart?
Thank you
Accepted Solutions
- Mark as New
- Bookmark
- Subscribe
- Mute
- Subscribe to RSS Feed
- Permalink
- Report Inappropriate Content
Sort both charts the same way by enabling numerical sort for the class dimension
talk is cheap, supply exceeds demand
- Mark as New
- Bookmark
- Subscribe
- Mute
- Subscribe to RSS Feed
- Permalink
- Report Inappropriate Content
Sort both charts the same way by enabling numerical sort for the class dimension
talk is cheap, supply exceeds demand