Unlock a world of possibilities! Login now and discover the exclusive benefits awaiting you.
- Qlik Community
- :
- All Forums
- :
- QlikView App Dev
- :
- Re: Which option is better, Dimension or new colum...
- Subscribe to RSS Feed
- Mark Topic as New
- Mark Topic as Read
- Float this Topic for Current User
- Bookmark
- Subscribe
- Mute
- Printer Friendly Page
- Mark as New
- Bookmark
- Subscribe
- Mute
- Subscribe to RSS Feed
- Permalink
- Report Inappropriate Content
Which option is better, Dimension or new column in the script?
Hello!
I'm new to the community and currently learning Qlikview on my own. Please be considerate! If I'm posting this in the wrong place please tell me and I'll try to move it. Thanks!
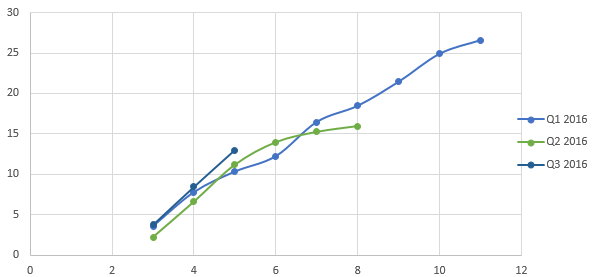
I need to build a Chart with multiple populations that have unique creation dates. I need to arrange them by date but the dates are grouped by quarter and I need the dimension to start as Nr. 1 for the first month of each quarter. It's thought to compare the behavior throughout the months. Let me show you an example:
| Month | CreationDate | Expression |
|---|---|---|
| 01/01/2016 | 01/01/2016 | 1 |
| 01/02/2016 | 01/01/2016 | 1.1 |
| 01/03/2016 | 01/02/2016 | 1.1 |
| 01/05/2016 | 01/04/2016 | 1.1 |
| 01/05/2016 | 01/05/2016 | 1 |
The problem is that the Creation Date must be grouped by Quarters. The chart with some more real data would look like this:
The dimension formula I came up with is this one (but I didn't success):
=((Year(Month)-Year(CreationDate))*12+Month(Month)-Month(CreationDate))+If(Mod(Month(CreationDate),3)=0,2)+If(Mod(Month(CreationDate),3)=2,1)
I also tried adding the formula as a column in the script so I could use it as a dimension but could find how to make a column with such a formula.
Regards and Thanks in advance!
Accepted Solutions
- Mark as New
- Bookmark
- Subscribe
- Mute
- Subscribe to RSS Feed
- Permalink
- Report Inappropriate Content
Why should there be 6 of them? There are 4 quarters, right? So do you expect 4 or 6?
Another option (in addition to vishsaggi's response) would be
=RangeSum(
((Year(Month)-Year(CreationDate))*12+Month(Month)-Month(CreationDate)),
Pick(Mod(Month(CreationDate),3) + 1, 2, 0, 1))
But I wonder why don't you do this in the script to avoid overhead on the front end?
Vintage:
LOAD Month,
Tipo,
Object,
CreationDate,
RangeSum(((Year(Month)-Year(CreationDate))*12+Month(Month)-Month(CreationDate)), Pick(Mod(Month(CreationDate),3) + 1, 2, 0, 1)) as NewDimension,
SalesMan,
Value1,
Value2,
Value3,
RangeSum(Value1,Value2,Value3) as [Values]
FROM
[\\SERVIDOR\Documentos\07 Sistemas\Qlik\Pruebas funcionamiento\Caso Quarter\Ene-16.xlsx]
(ooxml, embedded labels, table is Hoja1);
Concatenate (Vintage)
LOAD Month,
Tipo,
Object,
CreationDate,
RangeSum(((Year(Month)-Year(CreationDate))*12+Month(Month)-Month(CreationDate)), Pick(Mod(Month(CreationDate),3) + 1, 2, 0, 1)) as NewDimension,
SalesMan,
Value1,
Value2,
Value3,
RangeSum(Value1,Value2,Value3) as [Values]
FROM
[\\SERVIDOR\Documentos\07 Sistemas\Qlik\Pruebas funcionamiento\Caso Quarter\Feb-16.xlsx]
(ooxml, embedded labels, table is Hoja1);
Now all your need is to use NewDimension as your dimension
- Mark as New
- Bookmark
- Subscribe
- Mute
- Subscribe to RSS Feed
- Permalink
- Report Inappropriate Content
Would you be able to share a sample to look at this?
Preparing examples for Upload - Reduction and Data Scrambling
- Mark as New
- Bookmark
- Subscribe
- Mute
- Subscribe to RSS Feed
- Permalink
- Report Inappropriate Content
Hello Sunny,
I'm attaching an example. The chart has only 1 dimension when there should be multiple dimensions (like 6 of them).
Thank you for the tutorials!
Regards,
- Mark as New
- Bookmark
- Subscribe
- Mute
- Subscribe to RSS Feed
- Permalink
- Report Inappropriate Content
Try this in your Dimension?
= ((Num(Year(Month)) - Num(Year(CreationDate))) * 12) +
Num(Month(Month)) - Month(CreationDate) +
Num(If(Num(Mod(Num(MOnth(CreationDate)), 3))= 0, 2, 0)) +
Num(If(Num(Mod(Num(MOnth(CreationDate)), 3))= 2,1, 0))
- Mark as New
- Bookmark
- Subscribe
- Mute
- Subscribe to RSS Feed
- Permalink
- Report Inappropriate Content
Why should there be 6 of them? There are 4 quarters, right? So do you expect 4 or 6?
Another option (in addition to vishsaggi's response) would be
=RangeSum(
((Year(Month)-Year(CreationDate))*12+Month(Month)-Month(CreationDate)),
Pick(Mod(Month(CreationDate),3) + 1, 2, 0, 1))
But I wonder why don't you do this in the script to avoid overhead on the front end?
Vintage:
LOAD Month,
Tipo,
Object,
CreationDate,
RangeSum(((Year(Month)-Year(CreationDate))*12+Month(Month)-Month(CreationDate)), Pick(Mod(Month(CreationDate),3) + 1, 2, 0, 1)) as NewDimension,
SalesMan,
Value1,
Value2,
Value3,
RangeSum(Value1,Value2,Value3) as [Values]
FROM
[\\SERVIDOR\Documentos\07 Sistemas\Qlik\Pruebas funcionamiento\Caso Quarter\Ene-16.xlsx]
(ooxml, embedded labels, table is Hoja1);
Concatenate (Vintage)
LOAD Month,
Tipo,
Object,
CreationDate,
RangeSum(((Year(Month)-Year(CreationDate))*12+Month(Month)-Month(CreationDate)), Pick(Mod(Month(CreationDate),3) + 1, 2, 0, 1)) as NewDimension,
SalesMan,
Value1,
Value2,
Value3,
RangeSum(Value1,Value2,Value3) as [Values]
FROM
[\\SERVIDOR\Documentos\07 Sistemas\Qlik\Pruebas funcionamiento\Caso Quarter\Feb-16.xlsx]
(ooxml, embedded labels, table is Hoja1);
Now all your need is to use NewDimension as your dimension
- Mark as New
- Bookmark
- Subscribe
- Mute
- Subscribe to RSS Feed
- Permalink
- Report Inappropriate Content
Hello Sunny,
When i am using this in textbox
-> Month(Month)-Month(CreationDate))
Month() returns 3letter Month name which is a string right? so in RangeSum() will it take the string or the actual MonthNo?
- Mark as New
- Bookmark
- Subscribe
- Mute
- Subscribe to RSS Feed
- Permalink
- Report Inappropriate Content
Month() returns a dual value where Jan is equivalent to 1 and Feb is equivalent to 2 and so on.... So RangeSum() will work
- Mark as New
- Bookmark
- Subscribe
- Mute
- Subscribe to RSS Feed
- Permalink
- Report Inappropriate Content
Ahh, got it now. Thanks for that.
- Mark as New
- Bookmark
- Subscribe
- Mute
- Subscribe to RSS Feed
- Permalink
- Report Inappropriate Content
Many many thanks for your answer. Both solutions worked neatly.
From your answer I get that everytime I need to have some sort of calculated variable I should use the script if able to unload the front end. That answers the question in the Topic.
Regards and thanks again!
- Mark as New
- Bookmark
- Subscribe
- Mute
- Subscribe to RSS Feed
- Permalink
- Report Inappropriate Content
You got it... Always a good idea to perform a calculation in the script because calculations on the front end will slow down the application for your users. You don't want your users to wait for the information. But there needs to be a balance. If we run everything in the script then the app might continue to reload for hours and in that time the information might just become stale.
Best,
Sunny