Unlock a world of possibilities! Login now and discover the exclusive benefits awaiting you.
- Qlik Community
- :
- All Forums
- :
- QlikView App Dev
- :
- YTD not working
- Subscribe to RSS Feed
- Mark Topic as New
- Mark Topic as Read
- Float this Topic for Current User
- Bookmark
- Subscribe
- Mute
- Printer Friendly Page
- Mark as New
- Bookmark
- Subscribe
- Mute
- Subscribe to RSS Feed
- Permalink
- Report Inappropriate Content
YTD not working
Dear all,
Please see below simple database with :
Date
Sales
Salesman
I need to produce two outpout.
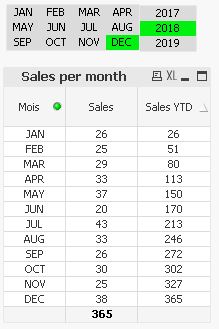
First output is a table showing per month, the monthly sales value as well as the year to date sales.
No issue here as you can see below :
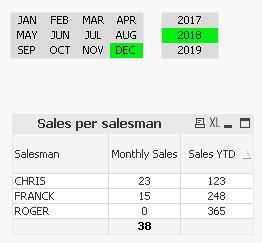
Second output is a table showing per salesman the monthly sales as well as the year to date sales. This is where my ytd figures is not tying :
What i gor from YTD figures if December 2018 is selected is :
123 for Chris
248 for Franck
365 for Roger
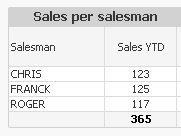
Although what i should get is :
123 for Chris
125 for Franck
117 for Roger.
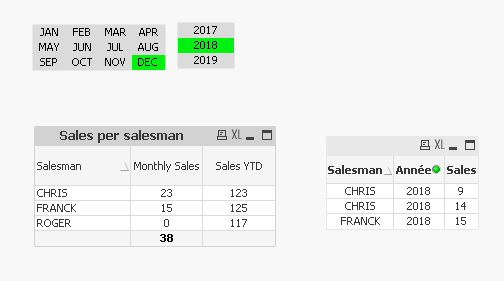
The formulas used is "RangeSum(Above(Sum({$<Date = {"$(='>=' & Date(YearStart(Max(Date)), 'DD/MM/YYYY') & '<=' & Date(Max(Date), 'DD/MM/YYYY'))"}, Mois, [Année]>}Sales), 0, RowNo()))" with Salesman as dimension.
Attached are qvw and excel test database for the ones who may help
Thanks in advance
Guillaume
Accepted Solutions
- Mark as New
- Bookmark
- Subscribe
- Mute
- Subscribe to RSS Feed
- Permalink
- Report Inappropriate Content
Since you are not using date/Month/Year as a dimension anymore... you don't need RangeSum(Above()) here... try this
Sum({$<Date = {"$(='>=' & Date(YearStart(Max(Date)), 'DD/MM/YYYY') & '<=' & Date(Max(Date), 'DD/MM/YYYY'))"}, Mois, [Année]>}Sales)
- Mark as New
- Bookmark
- Subscribe
- Mute
- Subscribe to RSS Feed
- Permalink
- Report Inappropriate Content
Thanks a lot.
Working perfect