Unlock a world of possibilities! Login now and discover the exclusive benefits awaiting you.
- Qlik Community
- :
- All Forums
- :
- QlikView App Dev
- :
- Re: aggregation on calculated dimension
- Subscribe to RSS Feed
- Mark Topic as New
- Mark Topic as Read
- Float this Topic for Current User
- Bookmark
- Subscribe
- Mute
- Printer Friendly Page
- Mark as New
- Bookmark
- Subscribe
- Mute
- Subscribe to RSS Feed
- Permalink
- Report Inappropriate Content
aggregation on calculated dimension
Hi everyone,
from the table below :
A
Element A1 |
Element A2 |
Element A3 |
Element A4 |
Element A5 |
Element B1 |
Element B2 |
Element B3 |
Element C1 |
Element C2 |
Element C3 |
Element C4 |
Element D1 |
Element D2 |
Element D3 |
Element D4 |
Element E1 |
Element E2 |
Element E3 |
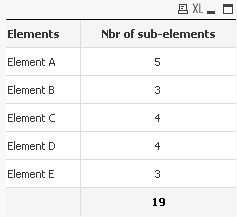
i created a first chart using Left(trim(A),Len(trim(A))-1) as a calculated dimension and Count(A) as expression then i get this result

from here i want to create a second chart so i get this result :
5 -> 1 ( 1 element A ),
4 -> 2 ( 2 elements C and D) ,
3 -> 2 ( 2 elements B and E)
i tried aggregation but no results
any idea ?
- Mark as New
- Bookmark
- Subscribe
- Mute
- Subscribe to RSS Feed
- Permalink
- Report Inappropriate Content
One way of getting the result using script is attached.
- Mark as New
- Bookmark
- Subscribe
- Mute
- Subscribe to RSS Feed
- Permalink
- Report Inappropriate Content
thanks for your help
But is there another method ( not in the load script ) to get the same result directly on the chart by using aggregation or something else ?
- Mark as New
- Bookmark
- Subscribe
- Mute
- Subscribe to RSS Feed
- Permalink
- Report Inappropriate Content
Hi , Add new field to your script called B by using: Left(Trim(A),Len(A)-1)
Then create the Calculated dimension: Aggr(Count(A) ,B)
Expression: Count(Distinct B)
Please find the attached file for reference.
- Mark as New
- Bookmark
- Subscribe
- Mute
- Subscribe to RSS Feed
- Permalink
- Report Inappropriate Content
I don't think this is possible without doing it in the script. As far as I am aware of you can not do a calculation in the dimension part of the aggr function.
So,
AGGR( Count(A) , Left(trim(A),Len(trim(A))-1) ) would not work.
- Mark as New
- Bookmark
- Subscribe
- Mute
- Subscribe to RSS Feed
- Permalink
- Report Inappropriate Content
Hi,
Please find attachment.
T:
LOAD Left(trim(A),Len(trim(A))-1) as Dim,A INLINE [
A
Element A1
Element A2
Element A3
Element A4
Element A5
Element B1
Element B2
Element B3
Element C1
Element C2
Element C3
Element C4
Element D1
Element D2
Element D3
Element D4
Element E1
Element E2
Element E3
];
T1:
LOAD Dim,Count(A) as Val Resident T Group By Dim;
- Now add Dimension as Dim and expr as = aggr(NODISTINCT Count(Val),Val)
Hope it helps you!!!!
Thanks,
Jagan